• This is default featured slide 1 title

    Go to Blogger edit html and find these sentences.Now replace these sentences with your own descriptions.This theme is Bloggerized by Lasantha Bandara - Premiumbloggertemplates.com.

  • This is default featured slide 2 title

    Go to Blogger edit html and find these sentences.Now replace these sentences with your own descriptions.This theme is Bloggerized by Lasantha Bandara - Premiumbloggertemplates.com.

  • This is default featured slide 3 title

    Go to Blogger edit html and find these sentences.Now replace these sentences with your own descriptions.This theme is Bloggerized by Lasantha Bandara - Premiumbloggertemplates.com.

  • This is default featured slide 4 title

    Go to Blogger edit html and find these sentences.Now replace these sentences with your own descriptions.This theme is Bloggerized by Lasantha Bandara - Premiumbloggertemplates.com.

  • This is default featured slide 5 title

    Go to Blogger edit html and find these sentences.Now replace these sentences with your own descriptions.This theme is Bloggerized by Lasantha Bandara - Premiumbloggertemplates.com.

Showing posts with label Cost of equity. Show all posts

Thursday, January 24, 2019

January 2019 Data Update 5: Hurdle Rates and Costs of Financing

In the last post, I looked at how to measure risk from different perspectives, with the intent of bringing these risk measures into both corporate finance and valuation. In this post, I will close the circle by converting risk measures into hurdle rates, critical in corporate finance, since they drive whether companies should invest or not, and in valuation, because they determine the values of businesses. As with my other data posts, the focus will remain on what these hurdle rates look like for companies around the world at the start of 2019.

A Quick Introduction
The simplest way to introduce hurdle rates is to look at them from the perspectives of the capital providers to a business. Using a financial balance sheet as my construct, here is a big picture view of these costs:

Thus. the hurdle rate for equity investors, i.e., the cost of equity, is the rate that they need to make, to break even, given the risk that they perceive in their equity investments. Lenders, on the other hand, incorporate their concerns about default risk into the interest rates they set on leans, i.e., the cost of debt. From the perspective of a business that raises funds from both equity investors and lenders, it is a weighted average of what equity investors need to make and what lenders demand as interest rates on borrowing, that represents the overall cost of funding, i.e., the cost of capital.

I have described the cost of capital as the Swiss Army Knife of finance, used in many different contexts and with very different meanings. I have reproduced below the different uses in a picture:
Paper on cost of capital
It is precisely because the cost of capital is used in so many different places that it is also one of the most misunderstood and misused numbers in finance. The best way to reconcile the different perspectives is to remember that the cost of capital is ultimately determined by the risk of the enterprise raising the funding, and that all of the many risks that a firm faces have to find their way into it. I have always found it easiest to break the cost of capital into parts, and let each part convey a specific risk, since if I am careless, I end up missing or double counting risk. In this post, I will break the risks that a company faces into four groups: the business or businesses the company operates in (business risk), the geographies that it operates in (country risk), how much it has chosen to borrow (financial leverage risk) and the currencies its cash flows are in (currency effects). 

Note that each part of the cost of capital has a key risk embedded in it. Thus, when valuing a company, in US dollars, in a safe business in a risky country, with very little financial leverage, you will see the 10-year US treasury bond rate as my risk free rate, a low beta (reflecting the safety of the business and low debt), but a high equity risk premium (reflecting the risk of the country).  The rest of this post will look at each of the outlined risks.

I. Business Risk
In my last post, where I updated risk measures across the world, I also looked at how these measures varied across different industries/businesses. In particular, I highlighted the ten most risky and safest industries, based upon both price variability and earnings variability, and noted the overlap between the two measures. I also looked at how the perceived risk in a business can change, depending upon investor diversification, and captured this effect with the correlation with the overall market.  If you are diversified, I argued that you would measure the risk in an investment with the covariance of that investment with the market, or in its standardized form, its beta.

To get the beta for a company, then, you can adopt one of two approaches.
  • The first, and the one that is taught in every finance class, is to run a regression of returns on the stock against a market index and to use the regression beta. 
  • The second, and my preferred approach, is to estimate a beta by looking at the business or businesses a company operates in, and taking a weighted average of the betas of companies in that business. 
To use the second approach, you need betas by business, and each year, I estimate these numbers by averaging the betas of publicly traded companies in each business. These betas, in addition to reflecting the risk of the business, also reflect the financial leverage of companies in that business (with more debt pushing up betas) and their holdings in cash and marketable securities (which, being close to risk less, push down betas). Consequently, I adjust the average beta for both variables to estimate what is called a pure play or a business beta for each business. (Rather than bore you with the mechanics, please watch this video on how I make these adjustments). The resulting estimates are shown at this link, for US companies. (You can also download the spreadsheets that contain the estimates for other parts of the world, as well as global averages, by going to the end of this post).

To get from these business betas to the beta of a company, you need to first identify what businesses the company operates in, and then how much value it derives from each of the businesses. The first part is usually simple to do, though you may face the challenge of finding the right bucket to put a business into, but the second part is usually difficult, because the individual businesses do not trade. You can use revenues or operating income by business as approximations to estimate weights or apply multiples to each of these variables (by looking at what other companies in the business trade at) to arrive at value weights. 

II. Financial Leverage
You can run a company, without ever using debt financing, or you can choose to borrow money to finance operations. In some cases, your lack of access to new equity may force you to borrow money and, in others, you may borrow money because you believe it will lower your cost of capital. In general, the choice of whether you use debt or equity remains one of the key parts of corporate finance, and I will discuss it in one of my upcoming data posts. In this post, though, I will just posit that your cost of capital can be affected by how much you borrow, unless you live in a world where there are no taxes, default risk or agency problems, in which case your cost of capital will remain unchanged as your funding mix changes.  If you do borrow money to fund some or a significant portion of your operations, there are three numbers that you need to estimate for your cost of capital:
  1. Debt Ratio: Th mix of debt and equity that you use represents the weights in your cost of capital.
  2. Beta Effect: As you borrow money, your equity will become riskier, because it is a residual claim, and having more interest expenses will make that claim more volatile. If you use beta as your measure of risk, this will require you to adjust upwards the business (or unlettered) beta that you obtained in the last part, using the debt to equity ratio of the company. 
  3. Cost of Debt: The cost of debt, which is set by lenders based upon how much default risk that they see in a company, will enter the cost of capital equation, with an added twist. To the extent that the tax law is tilted towards debt, the after-tax cost of borrowing will reflect that tax benefit. Since this cost of debt is a cost of borrowing money, long term and today, you cannot use a book interest rate or the interest rate on existing debt. Instead, you have to estimate a default spread for the company, based upon either its bond ratings or financial ratios, and add that spread on to the risk free rate:
I look at the debt effect on the cost of capital in each of the industries that I follow, with all three effects incorporated in this link, for US companies. The data, broken down, by other regional sub-groupings is available at the end of this post.

III. Country Risk
It strikes me as common sense that operating in some countries will expose you to more risk than operating in others, and that the cost of capital (hurdle rate) you use should reflect that additional risk. While there are some who are resistant to this proposition, making the argument that country risk can be diversified by having a global portfolio, that argument is undercut by rising correlations across markets. Consequently, the question becomes not whether you should incorporate country risk, but how best to do it. There are three broad choices:
  1. Sovereign Ratings and Default Spreads: The vast majority of countries have sovereign ratings, measuring their default risk, and since these ratings go with default spreads, there are many who use these default spreads as measures of country risk. 
  2. Sovereign CDS spreads: The Credit Default Swap (CDS) market is one where you can buy insurance against sovereign default, and it offers a market-based estimate of sovereign risk. While the coverage is less than what you get from sovereign ratings, the number of countries where you can obtain these spreads has increased over time to reach 71 in 2019. 
  3. Country Risk Premiums: I start with the default spreads, but I add a scaling factor to reflect the reality that equities are riskier than government bonds to come up with country risk premiums. The scaling factor that I use is obtained by dividing the volatility of an emerging market equity index by the volatility of emerging market bonds. 
To incorporate the country risk into my cost of capital calculations, I start with the implied equity risk premium that I estimated for the US (see my first data post for 2019) or 5.96% and add to it the country risk premium for each country. The full adjustment process is described in this picture:

I also bring in frontier markets, which have no sovereign ratings, using a country risk score estimated by Political Risk Services. The final estimates of equity risk premiums around the world can be seen in the picture below:

You can see these equity risk premiums as a list by clicking here, or download the entire spreadsheet here. If you prefer a picture of equity risk around the world, my map is below:
Download spreadsheet
I also report regional equity risk premiums, computed by taking GDP-weighted averages of the equity risk premiums of the countries int he region.

IV. Currency Risk
It is natural to mix up countries and currencies, when you do your analysis, because the countries with the most risk often have the most volatile currencies. That said, my suggestion is that you keep it simple, when it comes to currencies, recognizing that they are scaling or measurement variables rather than fundamental risk drivers. Put differently, you can choose to value a Brazilian companies in US dollars, but doing so does not make Brazilian country risk go away.

So, why do currencies matter? It is because each one has different expectations of inflation embedded in it, and when using a currency, you have to remain inflation-consistent. In other words, if you decide to do your analysis in a high inflation currency, your discount rate has to be higher, to incorporate the higher inflation, and so do your cash flows, for the same reason:

There are two ways in which you can bring inflation into discount rates.  The first is to use the risk free rate in that currency as your starting point for the calculation, since risk free rates will be higher for high inflation currencies. The challenge is finding a risk free investment in many emerging market currencies, since even the governments bonds, in those currencies, have default risk embedded in them. I attempt to overcome this problem by starting with the government bond but then netting the default spread for the government in question from that bond to arrive at risk free rates:
Download raw data
These rates are only as reliable as the government bond rates that you start with, and since more than two thirds of all currencies don't even have government bonds and even on those that do, the government bond rate does not come from liquid markets, there a second approach that you can use to adjust for currencies. In this approach, you estimate the cost of capital in a currency that you feel comfortable with (in terms of estimating risk free rates and risk premiums) and then add on or incorporate the differential inflation between that currency and the local currency that you want to convert the cost of capital to. Thus, to convert the cost of capital in US $ terms to a different currency, you would do the following:

To illustrate, assume that you have a US dollar cost of capital of 12% for an Egyptian company and that the inflation rates are 15% and 2% in Egyptian Pounds and US dollars respectively:
The Egyptian pound cost of capital is 26.27%. Note that there is an approximation that is often used, where the differential inflation is added to the US dollar cost of capital; in this case your answer would have been 25%. The key to this approach is getting estimates of expected inflation, and while every source will come with warts, you can find the IMF's estimates of expected inflation in different currencies at this link.

General Propositions
Every company, small or large, has a hurdle rate, though the origins of the number are murky at most companies. The approach laid out in this post has implications for how hurdle rates get calculated and used.
  1. A hurdle rate for an investment should be more a reflection the risk in the investment, and less your cost of raising funding: I fault terminology for this, but most people, when asked what a cost of capital is, will respond with the answer that it is the cost of raising capital. In the context of its usage as a hurdle rate, that is not true. It is an opportunity cost, a rate of return that you (as a company or investor) can earn on other investments in the market of equivalent risk. That is why, when valuing a target firm in an acquisition, you should always use the risk characteristics of the target firm (its beta and debt capacity) to compute a cost of capital, rather than the cost of capital of the acquiring firm.
  2. A company-wide hurdle rate can be misleading and dangerous: In corporate finance, the hurdle rate becomes the number to beat, when you do investment analysis. A project that earns more than the hurdle rate becomes an acceptable one, whether you use cash flows (and compute a positive net present value) or income (and generate a return greater than the hurdle rate). Most companies claim to have a corporate hurdle rate, a number that all projects that are assessed within the company get measured against. If your company operates in only one business and one country, this may work, but to the extent that companies operate in many businesses across multiple countries, you can already see that there can be no one hurdle rate. Even if you use only one currency in analysis, your cost of capital will be a function of which business a project is in, and what country it is aimed at. The consequences of not making these differential adjustments will be that your safe businesses will end up subsidizing your risky businesses, and over time, both will be hurt, in what I term the "curse of the lazy conglomerate".
  3. Currency is a choice, but once chosen, should not change the outcome of your analysis: We spend far too much time, in my view, debating what currency to do an analysis in, and too little time working through the implications. If you follow the consistency rule on currency, incorporating inflation into both cash flows and discount rates, your analyses should be currency neutral. In other words, a project that looks like it is a bad project, when the analysis is done in US dollar terms, cannot become a good project, just because you decide to do the analysis in Indian rupees. I know that, in practice, you do get divergent answers with different currencies, but when you do, it is because there are inflation inconsistencies in your assessments of discount rates and cash flows.
  4. You cannot (and should not) insulate your cost of capital from market forces: In both corporate finance and investing, there are many who remain wary of financial markets and their capacity to be irrational and volatile. Consequently, they try to generate hurdle rates that are unaffected by market movements, a futile and dangerous exercise, because we have to be price takers on at least some of the inputs into hurdle rates. Take the risk free rate, for instance. For the last decade, there are many analysts who have replaced the actual risk free rate (US 10-year T.Bond rate, for instance) with a "normalized' higher number, using the logic that interest rates are too low and will go up. Holding all else constant, this will push up hurdle rates and make it less likely that you will invest (either as an investor or as a company), but to what end? That uninvested money cannot be invested at the normalized rate, since it is fictional and exists only in the minds of those who created it, but is invested instead at the "too low" rate. 
  5. Have perspective: In conjunction with the prior point, there seems to be a view in some companies and for some investors, that they can use whatever number they feel comfortable with as hurdle rates. To the extent that hurdle rates are opportunity costs in the market, this is not true. The cost of capital brings together all of the risks that we have listed in this section. If nothing else, to get perspective on what comprises high or low, when it comes to cost of capital, I have computed a histogram of global and US company costs of capital, in US $ terms.

    You can convert this table into any currency you want. The bottom line is that, at least at the start of 2019, a dollar cost of capital of 14% or 15% is an extremely high number for any publicly traded company. You can see the costs of capital, in dollar terms, for US companies at this link, and as with betas, you can download the cost of capital, by industry, for other parts of the world in the data links below this post.
In short, if you work at a company, and you are given a hurdle rate to use, it behooves you to ask questions about its origins and logic. Often, you will find that no one really seems to know and/or the logic is questionable.

YouTube Video


Data Sets
  1. Betas by Business: US, Global, Emerging Markets, Europe, Japan, India, China, Aus & Canada
  2. Sovereign Ratings and CDS Spreads by Country in January 2019
  3. Equity Risk Premiums by Country in January 2019
  4. Risk free Rates by Currency: Government bond based
  5. Cost of Capital in US $ (with conversion equation for other currencies): USGlobalEmerging MarketsEuropeJapanIndiaChinaAus & Canada
Share:

Friday, January 26, 2018

January 2018 Data Update 6: A Cost of Capital Primer

I have long described the cost of capital as the Swiss Army Knife of finance, since it shows up in so many places in finance, albeit in different forms. In corporate finance, it is not only the cost of raising funding for a business but also the hurdle rate to use in capital budgeting and an optimizing tool for capital structure and dividend policy. In valuation, it is the discount rate that we use to value a business and the only mechanism for incorporating the risk of a business into its value. Along the way, it picks up a variety of other names that are used to describe it (with my least favorite one being the WACC acronym) and gets confused or used interchangeably with the cost of equity. In short, it is not surprising that there seems to be little consensus on how to estimate the cost of capital for a business.

The Cost of Capital: Definition
It is unfortunate that the name that we have attached to this ubiquitous number is the cost of capital, since it seems to suggest that it is the cost of raising funding for a company. While that definition may sometimes fit, it often leads to destructive consequences, where companies that are safe and can raise equity or borrow money at low rates (and hence have a low cost of funding) think that they are adding value when they go out and take risky investments that earn more than that cost. A company that has a 5% cost of capital is not always adding value if it takes an investment that generates an 8% return, if the investment is risky enough to require a much higher return. A healthier definition of the cost of capital is to think of it as an opportunity cost, i.e., a rate of return that you (as an investor or by extension, a company that the investor has put money in) can make on an investment of equivalent risk. The key words in this definition are "equivalent risk", because that effectively eliminates the subsidy mistake that occurs when a safe company's cost of capital is used to justify taking a risky investment. This is, of course, one of the first principles of finance and it is astonishing that it is open for debate and that so many companies violate it, in their practices. If you are skeptical of my claim, consider the following manifestations of this malpractice:
  1. Many multi-business companies continue to have a "single" hurdle rate in capital budgeting: In a survey of "best" practices across companies and advisors, the authors note that almost half of all companies (and advisors) surveyed used a single cost of capital across all investments.  That is not only not good practice, but over time, it will ensure that your entire company will become a riskier company that takes bad investments. While I appreciate the work that went into this survey, I would suggest that the authors seriously reconsider using the word "best" to describe many of the horrendous practices that companies use in computing cost of capital. Looking at surveys of how companies compute costs of capital around the world, it seems clear to me that  bad practices drive out good ones, a manifestation of Gresham's law in corporate finance practice.
  2. In acquisitions, it is routine for companies (and bankers) to use the acquiring company's cost of capital to value the target company: While I cannot point to surveys to back up this statement, in my experience, this happens in more than 60% of acquisitions, with the logic being that it is the acquiring firm that raises the capital and that its costs should therefore be covered. The fact that will lead safe firms to find any risky firm that they look at to be cheap is glossed over. If you are waffling, let me be absolutist. Valuing a target company using an acquiring company's cost of capital is valuation malpractice, and if you do it, you should be stripped of your license to do valuation.
  3. Cash is viewed as a value destroying asset: If you follow GAAP or IFRS, for an asset to be categorized with cash and short term investments, it has to be invested in liquid and close to riskless assets. In the last decade, these investments, not surprisingly, have generated extraordinarily low returns, but it is true, no matter what interest rate environment you are in, that cash will earn lower returns than operating investments. There are analysts, and I use the word loosely, who compare the returns generated on cash to the cost of capital of the firm to conclude that cash is a value-destroying asset and that it should be returned. While there are legitimate arguments that can be made that companies should return cash to stockholders, this is not one of them. In fact, cash, if invested in treasury bills or commercial paper, is a value-neutral investment, earning exactly the return that you need it to earn, given its liquid, diskless status.
  4. A company that earns a higher return on its projects (higher ROIC) should be valued more highly than a company that earns a lower return on its projects: Without controlling for risk, this is not true. In fact, the right assessment would require comparing the ROIC to the cost of capital to estimate an excess return and a company that earns a higher positive excess return should be valued more highly than one that earns a lower excess return.
The key, then, to estimating cost of capital is to to link it directly to a risk measure that can be computed not just for entire companies but for individual projects. It is that pursuit that will drive my estimation process for cost of capital, described in the next section.

The Cost of Capital: Estimation Process
There are ultimately only two ways of raising funds to finance a business. One is to borrow the money (debt) and the other is to use your own money (equity). This is captured in one of my favorite corporate finance devices, the financial balance sheet:

With a small private business, the debt will take the form of a bank loan and the equity will be your savings, but as businesses scale up, debt may expand to include corporate bonds and equity may transition to venture capital, private equity and publicly traded stock. The structure also allows us to boil the cost of capital down to its three ingredients: a cost of equity, an after-tax cost of debt and the weights to attach to the two.

Cost of equity
The End game: In principle, the cost of equity is the rate of return that equity investors in your business need to make to compensate for the risk that they are exposed to.
The Practice:  For the last few decades, corporate finance has tried, with mixed success, to devise a risk and return model to estimate the cost of equity. While these models vary in complexity and inputs, they generally share a common theme. They estimate the cost of equity to the marginal investors in the business, i.e., investors who own and trade large blocks of shares, and assume that these investors are diversified. These models all share a common structure; they start with a risk free rate and then estimate a risk premium for an investment, by measuring its relative risk (on one or more market risk factors) and the price of risk or risk premiums (for these factors). While it is the subject of substantial abuse, the capital asset pricing model continues to be the default model that most practitioners use in estimating cost of equity. The resulting inputs are shown below:
I still use the capital asset pricing model in my valuations and I offer no apologies for doing so, since I find it simple, intuitive and at least as effective as the next best alternative models, most of which add more complexity and deliver little in results.  For those who are truly disturbed by the CAPM's limitations, there is an alternative approach worth considering that is agnostic in its assumptions about investor diversification and risk aversion. It is to back out the "implied" cost of equity for stocks within a sector and to use that implied number as the cost of equity in individual companies. If you are puzzled about what this implies, take a look at how I estimated the implied equity risk premium for the S&P 500 in my second data post from a couple of weeks ago and consider extending that approach to the banking index, to get an implied cost of equity for banks, and the energy sector, to estimate the cost of equity for oil companies.

Cost of Debt
The End Game: The cost of debt for a firm is the rate at which it can borrow money, long term and today. The after-tax cost of debt is this borrowing rate, adjusted for any tax benefits that accrue to borrowing money.
The Practice: By defining the cost of debt as a current cost of borrowing, rather than the rate at which the firm has borrowed money in the past, I have simplified my estimation problem, since the cost of debt can then be written as the sum of the riskless rate and a default spread, reflecting the company's credit risk:
Pre-tax cost of debt = Risk free Rate + Default Spread for the Company
To estimate the default spread, you can use one of three approaches, in order of ease.
  • If the firm in question has corporate bonds outstanding, you can use the interest rate on the bond as your pre-tax cost of debt for the firm since it is a current, market-set rate. 
  • If a firm has corporate bonds and they are not traded enough or have features that skew the interest rate, you can use the bond rating for the company to estimate a default spread. 
  • If the firm has neither bonds nor a rating, a combination that holds for most companies, I would assess a "synthetic rating" for the company, based upon the strength of its financials and its capacity to repay debt.
To bring the tax benefit of debt into the after-tax cost of debt, you should use the marginal tax rate, since interest expenses save you taxes at the margin:
After-tax cost of debt = (Risk free Rate + Default Spread) (1- Marginal Tax Rate)
This cost of debt will be much lower than your cost of equity, for almost all firms.

Debt & Equity Weights
Market or Book? This choice, at least for me, is an easy one. The cost of capital is a measure for what it will cost you to raise money to fund the business, investment or project today, and since you can raise money only at market value, it is the only relevant number. 
Current or Target? This is an argument that often consumes analyst time and often misses the point. It is true that the debt ratio for a company can change over time, and if management does have a target, the actual debt ratio may move to the target. Unless this change is instantaneous, it is likely to occur over time and my answer to the question is to use the current debt ratio to estimate the cost of capital at the start of the investment and as the debt ratio is changed over time to the optimal, to change the cost of capital as well.

Cross Sectional Estimation
In choosing my estimation approach to getting cost of capital, do keep in mind that there are 43,848 firms in my sample and since looking at each one individually is out of the question, I will have to make some bludgeon assumptions (that I would not have made if I were estimating the cost of capital for an individual company). The table below summarizes my estimation choices, with the limitations of each:

Estimation Approach usedPossible limitations
Risk Free RateUS T.Bond RateCost of equity estimated in US dollars.
BetaStarted with unlevered beta for sector & levered up using company's D/E (including leases as debt)Used only the primary business that the company was in. With multi-business companies, I am missing the effect of oither businesses on beta.
ERP ERP of country that the company is incorporated in.If company operates in other countries, the ERP should be a weighted average.
Default SpreadUsed bond rating, if available, to estimate the default spread. Used interest coverage ratio to estimate ratings and default spread, otherwise.Interest coverage ratios may not capture default risk fully, Bringing in other ratios might have provided more refined estimate.
Marginal tax rateUse the statutory tax rate of the country in which the company is incorporated.If company operates in many countries, it may be able to place its debt in a country with the higher marginal tax rae.
WeightsCurrent market value of equity and debt (including leases) used for weights.Insufficient information to estimate market value of interest-bearing debt.

If you want to estimate the cost of capital, using more refined estimates (country weightings for ERP and business mixes for betas), you are welcome to try my cost of capital calculator. If you are working in another currency, converting my estimates of cost of capital to an alternate currency should be a simple exercise of adding the differential inflation rate between the currency in question and the US dollar to my estimate.

The Cost of Capital - Going Concern Concept
There is one important caveat to add about cost of capital specifically and discount rates, in discounted cash flow valuations, more generally. In a discounted cash flow valuation, we are implicitly assuming that the business that we are valuing is a going concern that will either survive for a long time or is on its path to a specified and clearly determined liquidation point.
So what? The reality is that business is risky and the essence of risk is that it can sometime deal out bad enough outcomes to put a company out of business. With a young start up, this may take the form of running out of cash and access to capital. With a declining company, it can be the failure to make a debt payment and the resulting financial distress. With a bank, it can take the form of a drop in regulatory capital below levels acceptable to the regulatory authorities and a shutting down of the bank. With an emerging market company, even a healthy company may see its survival threatened by a nationalization. These are risks that I call truncation risks and analysts often struggle with how best to bring them into value. One path that they try is to push discount rates (or costs of capital) higher for companies that face significant amounts of truncation risk, but discount rates are blunt instruments for dealing with this type of risk and my suggestion is that you not try to adjust them for the risk. Instead, you should consider using a decision tree front on your valuation, where you can bring in your truncation risk concerns separately from your DCF. With a distressed firm or start up, for instance, where you worry about survival risk, the decision tree will look as follows:

This will not only relieve you of the stress of trying to adjust discount rates for risk that they were never meant to convey but will allow you to focus on the truncation risk more directly. Thinking about the probability that you will not survive as a firm and what you will get, if you don't, is a much healthier exercise than arbitrarily pushing up your discount rate another 2%, because you feel the firm is riskier.

The Cost of Capital - Perspective
The cost of capital discussion is permeated with rules of thumb about what comprises reasonable, high or low numbers, many developed in a different time, and for a different market. These rules of thumb skew estimates, since analysts feel the urge to adjust the costs of capitals that they get from models or metrics to match their preconceptions about what they should be. It is my primary objection to the build-up approach for the cost of capital, where analysts add multiple premiums (small cap, illiquidity, company specific) to arrive at a cost of capital that matches what they would have liked to see in the first place. It is to counter this temptation that I will compute costs of capital for US and global companies and present both sector averages as well as the entire distributions for the market. 

US Companies
To provide perspective on what the cost of capital for the median US company will look like, start with the US 10-year T.Bond rate of 2.41% on January 1, 2018, as the risk free rate and my estimate of the implied ERP of 5.08% for the US on the same date. For an average risk stock, with a beta of one, that would translate into a cost of equity of 7.49%. Bringing in the debt ratio of 23.51% for the typical US firm and a pre-tax cost of debt of 3.91% (1.5% higher than the risk free rate), results in a cost of capital of 6.43%, if we use the marginal tax rate of 24%, post tax reform:
Cost of capital for median US firm = (2.41%+5.08%)(1-.2351)+3.91%(1-.24) (.2351) = 6.43%
Using the sector-specific debt ratios and betas yields costs of capital for US companies in individual sectors and the resulting costs of capital are reported in the table below:
Download full sector cost of capital spreadsheet
You can download the spreadsheet with the details of the cost of capital calculation by clicking on the link below. There is information in the company-specific costs of capital estimates that I have for 7.247 US firms in my sample that I try to capture in a histogram:

To the question of what comprises a high, low or average cost of capital, I would offer the deciles for the cost of capital estimation in 2018, also shown in the histogram. 

Global Companies
I estimate the costs of capital for global companies, in US dollars, and using the same template that I use for the US. There are two key differences. The first is that I shift from using the US ERP of 5.08% to a GDP-weighted global average ERP of 6.20%, from a US-average debt ratio of 23.51% to to a global-average debt to capital ratio of 26.67%, from a pre-tax cost of debt of 3.91% to 4.91% (reflecting country default risk) and from a marginal tax rate of 24% to a weighted average of 24.63%. The resulting cost of capital for a median global firm is higher than for the US:
Cost of capital for median global firm = (2.41%+6.20%)(1-.2667)+4.91%(1-.2463) (.2667) = 7.30%
As with the US data, I compute sector averages, using sector average betas and debt ratios and the results are summarized in the picture below:
Download full sector cost of capital spreadsheet
Finally, the distribution of costs of capital across global companies are captured in the histogram, with deciles specified:

Here again, I would use this distribution to make judgments of what a high, low or average cost of capital would look like in January 2018, and adding inflation differentials would provide analogous numbers in other currencies.

The Conclusion
Notwithstanding the length of this post, and the ones leading up to it, I do not believe that the cost of capital is the biggest driver of the value of companies. When you make mistakes in valuation, it is almost always true that the big mistakes are in your cash flow and growth estimates, rather than in your cost of capital. This is especially true when you value young companies, and it is one reason that I am almost casual in my choice of costs of capital in my valuation of Twitter, Uber and Snap, where I have attached costs of capital reflective of the 90th percentile in risk. It is true that as companies mature, the cost of capital becomes a more critical input, but even in these valuations, I would argue that if you are spending more than 20% to 25% of your time estimating it, you have lost your way.

YouTube Video


Paper
  1. Cost of Capital - The Swiss Army Knife of Finance\
Datasets
  1. Cost of Capital, by Industry Group - US data
  2. Cost of Capital, by Industry Group - Global
  3. Cost of Capital Calculator (Spreadsheet)
    Share:

    Wednesday, January 13, 2016

    January 2016 Data Update 4: The Costs of Capital

    In this post, the fourth in my data update series, I turn my focus to the cost of capital. While the discussion of cost of capital is often obscured by debates about risk and return models, it is a number central to much of what we do in corporate finance and valuation, and it predates modern portfolio theory. You cannot run a business without a sense of what you need to make on your investments to break even and you cannot value a business without a measure of your opportunity cost. 

    The Swiss Army Knife of Finance
    I teach two classes, corporate finance and valuation, and I wear different hats, when looking at the same questions. In corporate finance, my focus is on how to run a business, using fundamental financial principles, and in valuation, I shift my attention to how value that business, using the same principles. Like Waldo, the cost of capital is a constant part of both classes, playing a key role in almost every discussion.

    In the corporate finance class, it shows up in each of the three big questions that every business has to answer. It helps you answer the first one, on where you should direct your investments, by suppling your business with a hurdle rate or rates for investments, with riskier investments having to meet a higher threshold, to be acceptable.

    In capital structure, the cost of capital  becomes an optimizing tool that helps you decide the right mix of debt and equity.

    In dividend policy, the cost of capital becomes the divining rod for whether you should be returning more or less cash to your stockholders. If you operate in a business where your returns on new investments consistently fall short of your cost of capital, you should be returning more cash to your investors. 

    In the valuation class, the cost of capital is the discount rate that you use to bring operating cash flows back to today, to arrive at a value for a business. It has, unfortunately, also become the instrument that analysts use to bring their hopes, fears and worries into value, adding premiums to the discount rate, if an asset is illiquid, or reducing it, if it provides other benefits.

    In short, it is difficult to do financial analysis without at least getting a sense of what the cost of capital is, for a business. The many uses to which it is put has also meant that it has become all things to all people, a number that is misused, misestimated and misunderstood.

    The Mechanics of Estimating Cost of Capital
    About a year ago, in the context of my 2015 data update, I had an extensive post on the mechanics of computing cost of capital. Rather than repeat that post, I will direct you to it and summarize the process in a picture, for estimating the cost of capital for a company in US dollars:

    Thus, the cost of capital is a composite cost of equity and debt and incorporates the tax benefits of debt (through the after-tax cost of debt) and the risk added by debt in increased costs for both equity and debt. If you want to estimate the cost of capital in a different currency, you have two choices. The first is to replace the US dollar risk free rate with the other currency's risk free rate (seem my earlier post on currencies) or to add the differential inflation rate between the US dollar and the currency in question to a US dollar cost of capital. Thus, if your US dollar cost of capital is 10%, the inflation rate in rubles is 9.5% and the US dollar inflation rate is 1.5%, your Russian ruble cost of capital will be approximately 18%. (It is a little more precise to compute this rate allowing for the compounding: (1.10) (1.095/1.015) -1, but I will leave it up to you to decide whether it is worth the effort.)

    The Cost of Capital - US companies
    Let me start off with the US-centric portion of this post, where I look at the distribution of costs of capital across my sample of 7480 firms that are listed in the United States. In making my assessments, I made some simplifying assumptions:
    1. I used the US 10-year bond rate of 2.27%, on January 1, 2016, as my risk free rate. I don't like to play games normalizing risk free rates.
    2. I used the average unlevered beta for the sector as the beta for the company and levered this beta with the current debt to equity ratio of the firm.
    3. I used the implied equity risk premium for the S&P 500 (6.12% on January 1, 2016, rounded down to 6%) as the equity risk premium for all US companies in estimating the cost of equity. I know that some US companies have operating risk exposure outside the US, but I see no easy way that I can compute regional-weighted ERPs for this many companies.
    4. For the cost of debt, I used the S&P bond rating, if one was available, to estimate the default spreads and pre-tax cost of debt of the firm. For non-rated company, I used the standard deviation in equity in conjunction with a look up table (see the cost of capital spreadsheet) to estimate the default spread and pre-tax cost of debt. I used 40% as the marginal tax rate for the US in estimating the after-tax cost of debt.
    5. I used the current market capitalization as the value of equity and added up all interest bearing debt with the present value of lease commitments (for the next 5 years and beyond) to get to the debt, in computing the weights for debt and equity.
    The resulting distribution of costs of capital across US companies is summarized below. Note that 90% of US firms have costs of capital between 5.23% and 10% and 50% of US firms have costs of capital between 6.60% and 9.20%.


    If you are skeptical about betas and don't like computing costs of equity based upon them, I have a suggestion. Use the distribution of costs of capital in this graph, as your basis, for estimating a cost of capital for your firm. Use the cost of capital at the 90th percentile as your cost of capital for a risky firm, 8% as your cost of capital for a mature firm and 5.23% as your cost of capital for a very safe firm, and you should be relatively safe.

    The Cost of Capital - Global Distribution
    I also computed the cost of capital differences across global regions. Note that the differences are not rooted in currency, since the cost of capital for every firm is computed in US dollars. As to why costs of capital vary across countries, the answer can be traced back to two factors. The first is that debt ratios vary across the world, and that this may explain some of the variation. The second is that the regions of the world with higher sovereign default spreads and equity risk premiums (they go together in my approach) will have higher costs of capital than regions that have less risk. The table below summarizes the difference.

    US companies have the lowest costs of capital, on average, in the world and East European and Russian companies carry the highest costs of capital. These are all in US dollars, but you can use the differential inflation approach to convert them into other currencies.

    The Cost of Capital - Sector Differences
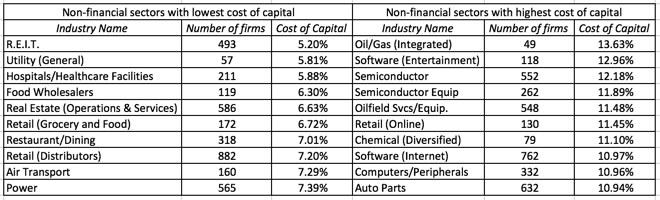
     Starting with the 41,889 firms that I have in my global sample at the start of 2016, I estimated the cost of capital for each company in dollar terms and then looked at the average costs of capital by sector. While you can find the entire sector list for cost of capital at the bottom of this post, I have listed the ten non-financial sectors with the highest costs of capital and the ten with the lowest:
    Source: Damodaran Online
    So, what now? If you have to estimate the cost of capital for a sector or a company in that sector, in US dollar terms, you could use the cost of capital for any companies that you value, in this sector. Again, adding the inflation differential will give you the cost of capital in any other currency. 

    The Bottom line
    The cost of capital may be the most used number in finance, but it is also the most misused. Companies often use one cost of capital to assess investments with different risk profiles, acting on the presumption that the cost of capital is the cost of raising company, rather than a risk adjusted required return for investing in a  risky asset. Investors use the cost of capital as a dumping ground for all their fears about investments, augmenting the standard risk-adjusted discount rate with premiums for liquidity, small market capitalization and opacity. We can do better!

    Presentation
    1. Cost of Capital: Misused, Misestimated and Misunderstood
    Share:

    Labels

    Blog Archive

    Recent Posts

    Unordered List

    Theme Support