• This is default featured slide 1 title

    Go to Blogger edit html and find these sentences.Now replace these sentences with your own descriptions.This theme is Bloggerized by Lasantha Bandara - Premiumbloggertemplates.com.

  • This is default featured slide 2 title

    Go to Blogger edit html and find these sentences.Now replace these sentences with your own descriptions.This theme is Bloggerized by Lasantha Bandara - Premiumbloggertemplates.com.

  • This is default featured slide 3 title

    Go to Blogger edit html and find these sentences.Now replace these sentences with your own descriptions.This theme is Bloggerized by Lasantha Bandara - Premiumbloggertemplates.com.

  • This is default featured slide 4 title

    Go to Blogger edit html and find these sentences.Now replace these sentences with your own descriptions.This theme is Bloggerized by Lasantha Bandara - Premiumbloggertemplates.com.

  • This is default featured slide 5 title

    Go to Blogger edit html and find these sentences.Now replace these sentences with your own descriptions.This theme is Bloggerized by Lasantha Bandara - Premiumbloggertemplates.com.

Saturday, January 30, 2016

Corporate Finance 101: A Big Picture, Applied Class!

In my last seven posts, I played my version of Moneyball with company data from the end of 2015, looking at how companies invest their shareholders' money, how much they borrow and the determinants of how much cash they return to stockholders. That structure is the one that underlies the corporate finance class that I have taught every year since 1984, the first two years at UC Berkeley, and the last 30 years at the Stern School of Business. Each semester, for the last few years, I have also invited you, even if you are not a Stern MBA student, to follow the class online, if you so desire, in all its gory details. If you are considering this options, I thought it would make sense to take you on a mini-tour of corporate finance, as a discipline, and how I aim to tackle it in this class.

Corporate Finance: The Big Picture
There are many versions of corporate finance that are taught in class rooms. There is the accounting version of corporate finance, that uses the historical, rule-bound construct of accounting as the basis for corporate finance. Decision making is driven by accounting ratios and financial statements, rather than first principles. There is the banking version of corporate finance, where the class is structured around what bankers do for firms, with the bulk of the class being spent on areas where firms interact with financial markets (M&A, financing choices) and the focus is less on what's right for the firms, and more on how the deal making works. My version of corporate finance is built around the first principles of running a business and it covers every aspect of business from production to marketing to even strategy. In case you are skeptical about the big picture version of this class, here is what it looks like:
All of corporate finance boils down to three broad decisions, the investment decision, which looks at where you should invest your resources, the financing decision, where you decide the right mix and type of debt to use in funding your business and the dividend decision, where you determine how much to hold back in the business (as cash or for reinvestment) and how much to return to the owners of the business.

Applied, not Theory
I find theory for the sake of theory to be arid, and I build my classes around a very simple proposition: if it cannot be applied, I don't talk about it. That application focus may put you off, but my class is essentially the equivalent of a corporate finance lab, where when I introduce a model or a hypothesis,  I get to try it out on real companies in real time. I use six companies through the entire class to illustrate both the theory and how its application can vary across companies:


Thus everything I do in the class, from estimating hurdle rates to determining finance mix to assessing dividend policy, I try on Disney (a large, US, entertainment firm), Vale (a global mining company, based in Brazil, with a government interest in it), Tata Motors (an India-based auto company, part of a family group), Baidu (a Chinese search engine company, traded as a shell company on the NASDAQ), Deutsche Bank (a messy, money center bank, with regulatory constraints) and a small privately owned bookstore in New York City (owned by a third-generation owner).

The Class Structure
The class starts on February 1, with a session from 10.30 to 11.50, and continues through May 9, with sessions every Monday and Wednesday, with a break week starting March 14. The lectures are supplemented with slides and my book on applied corporate finance, with the latter being completely optional, since you can live without it.  The calendar for the class is at this link.

There will be three 30-minute quizzes in the class, each worth 10%, spread out almost evenly across the first 22 sessions, and each quiz will be non-cumulative, covering only the 6-7 sessions prior. In keeping with my view that this is not about memorizing equations and formulas, the quizzes will be open books and open notes. There is a two-hour final exam, which is cumulative and will be after the final session  in May that will account for 30% of the grade.

There will be two projects, with the first being an investment case (that I have not written yet) that will make you decide on whether to make a big investment or not (Apple in the electric car market, Google buying Twitter etc.) and the second being a semester-long exercise of trying every aspect of corporate finance on a company of your choice.

The Online Version
If you are in my class, there is little more to be said, since I will see you in class on Monday. If you are not, you can still partake in almost all of the class. The lectures will not be carried live, but will be recorded and the webcasts should be up by late in the day, Mondays and Wednesdays, through the entire semester. You can find those webcasts in one of three forums:
  1. My website: The links to the webcasts, as well as links to my other material (lecture notes, handouts, even emails to the class) can be found at this link
  2. iTunes U: If you prefer a more polished format, I will also be putting the class online on iTunes U, the app that you can download from the Apple store for any Apple device. The link to the class is here and if already have Apple iTunes U installed on your device, you can add this class with the enroll code of EPF-JFH-SHE. 
  3. YouTube Playlist: I will also be putting the classes up on a playlist on my YouTube account. With each session that I put up, I will also add links to the lecture notes used in the session and additional exercise. 
Not only can you watch the lectures and review the notes, you can also try your hand at the quizzes and final exam, when they are given. I will post the exams, after the class has taken them, online and  I will post the solution, with the grading template that I used in class. You will be your own grader and may be tempted to go easy on yourself, but that's your choice. You can even do the case and the project, but I will unfortunately not have the resources to review or grade either. The good news is that none of this should dent your pocket book, but the bad news is that you will not get class credit or a certificate.

Alternative Routes
Each semester, I know that quite a few people start with my classes, but life very quickly gets in the way. One of the problems of online classes is that without the discipline of having to get to a physical class or concern about credit/grades, it is difficult to persevere to the end. I entirely understand this problem and if, after trying one or two classes or even a few, you decide that your life is too full for more stuff to be added on. I do have a few suggestions, if you still feel that you will gain from the class:
  1. Stretch it out: The class will stay online on all three forums for at least a year or two. Thus, you can stretch out the class to match your time schedule, instead of taking it in calendar time. I had at least three or four people completing the Spring 2012 class, last year.
  2. Online Corporate Finance class: If you find the 80-minute class sessions that make up this class unendurable, I do have a compressed version of the class, where I take each session and do it in 10-15 minutes, instead of 80 minutes. In a testimonial to how much we bulk up college classes, it was not that tough to do and you can find it on my website at this link, on iTunes U at this one or on YouTube at this one.
  3. Executive Corporate Finance class: I just completed a three-day corporate finance class for executive MBAs that is only a mildly compressed version of my regular class and you can find the links to the webcasts for that class on my website.
The End Game
I know that some of you may wonder what the catch is and where I plan to hit you up for fees. While you search for my hidden agenda, I have only one request of you. If you find any of the material in these classes to be useful to you, rather than thank me for it, please pass the favor on, by helping someone else learn, understand or do something. Not only will you get far more out of this simple act of kindness than the person that you offer it to, but I hope that you will also get a sense of why teaching is its own reward.

YouTube Intro to Class


Class links (Spring 2016 MBA class)
  1. My website
  2. iTunes U
  3. YouTube Playlist
Lecture Notes for Class
  1. Syllabus and Project
  2. Lecture Note Packet 1
  3. Lecture Note Packet 2
 Book if you want it
  1. Applied Corporate Finance, 4th Edition (Warning: It is obscenely over priced but there is not much that I can do about it. Sorry!)

Share:

Wednesday, January 27, 2016

January 2016 Data Update 7: Dividends, Potential Dividends and Cash Balances

In the last six posts, I have tried to look at the global corporate landscape, starting with how the market is pricing risk in the US and globally, how much investors are getting as risk free returns in different currencies and then moving on to differences across companies on the costs of raising funding (it varies by sector and region),  the quality of their investments (not that good) and their indebtedness (high in pockets). In this, the last of these posts, I propose to look at the final piece of the corporate finance picture, which is how much companies around the world returned to stockholders in dividends (and stock buybacks) and by extension, how much cash they chose to hold on for future investments. 

Dividends, Potential Dividends and Cash
Dividend policy is often the ignored step child of corporate finance, treated either as an obligation that has to be met by companies or as a sign of weaknesses by those who believe that companies exist only to build factories and invest resources. The reality is that dividends are a central reason for investing and unless cash gets returned to investors, and I am willing to expand my notion of dividends to include buybacks, there is no real payoff to investing. That said, the question of how much a company can pay in dividends is affected in most businesses, by investing and financing choices. If equity is a residual claim, as it is often posited to be, dividends should be the end-result of a series of decisions that companies make:

If  you accept the logic of this process, companies that have substantial cash from operations, access to debt and few investment opportunities should return more cash than companies without these characteristics.

In practice, the sequencing is neither this clean, nor logical. Dividend policy, more than any other aspect of corporate finance, is governed by inertia (an unwillingness to let go of past policy) and me-too-ism (a desire to be like everyone else in the sector) and as a consequence, it lends itself to dysfunctional behavior. In the first dysfunctional variant, rather than be the final choice in the business sequence, dividends become the first and the dominant part driving a business, with the decision on how much to pay in dividends or buy back in stock made first, and investment and financing decisions tailored to deliver those dividends. 

Not surprisingly, dividends then act as a drain on firm value, since companies will borrow too much and/or invest too little to maintain them.  In a diametrically opposite variant, managers act as if they own the companies they run, are reluctant to let go of cash and return as little as they can to stockholders, while building corporate empires.


These companies can afford to pay large dividends, choose not to do so and end up, not surprisingly, with huge cash balances. It is worth noting that the corporate life cycle, a structure that I have used repeatedly in my posts, provides some perspective on how dividend policy should vary across companies.

Dividend Policies across Companies
As with my other posts on the data, I started by looking at the dividends paid by the 41,889 companies in my sample, with an intent of getting a measure of what constitutes high or low dividends. So, here were go..

1. Measures of dividends: There are two widely used measures of dividends. The first when dividends are divided by net income to arrive at a dividend payout ratio, a measure of what proportion of earnings gets returned to stockholders (and by inversion, what proportion gets retained in the firm). The distribution of dividend payout ratios, using dividends and earnings from the most recent 12 months leading into January 2016,  is captured below:
Source: Damodaran Online
Note that more firms (23,022) did not pay dividends, than did (18,867), in 2015. Among those companies that paid dividends, the median payout ratio is between 30% and 40%.

The other dividend statistic is to divide dividends paid by market capitalization (or dividends per share by price per share) to estimate a dividend yield, a measure of the return that you as a stockholder can expect to generate from the dividends, on your investment. The rest of your expected return has to come from price appreciation. Again, using trailing 12-month dividends leading into and the price as of December 31, 2015, here is the distribution:
As with the payout, the yield is more likely to be zero than a positive number for a globally listed company, but the median dividend yield for a stock was between 2% and 3% in 2015.

2. The Buyback Option: For much of the last century, dividends were the only cash flows that stockholders in corporations received from the corporations. Starting in the 1980s, US companies have increasingly turned to a second option to returning cash to stockholders, buybacks. From an intrinsic value perspective, buybacks have exactly the same consequences to the company making them, as dividends, reducing cash in the hands of the company and increasing cash in the hands of stockholders. From the stockholders' perspective, there are differences, since every stockholder gets dividends (and has to pay taxes on it) while only those who sell their shares back get cash with buybacks, but leave the remaining stockholders with higher-priced stock. In the table below, I look at the proportion of the cash returned that took the form of buybacks for companies in different regions in the twelve months leading into January 2016:
While it is true that US companies have been in the forefront of the buyback boom, note that the EU and Japan are not far behind. Buybacks are not only here to stay, but are becoming a global phenomenon.

3. The Cash Balance Effect: Any discussion of dividends is also, by extension, a discussion of cash balances, since the latter are the residue of dividend policy. In this final graph, I look at cash balances at companies, as a percent of the market capitalizations of these companies. 
You may be a little puzzled about the companies that have cash balances that exceed the market capitalizations, but it can be explained by the presence of debt. Thus, if your market capitalization is $100 million and you have $150 million in debt outstanding, you could hold $150 million of that value in cash, leaving you with cash at 150% of market capitalization.

Industry Differences: The Me Too Effect
If a key driver of dividend policy is a desire to look like your peer group, it is useful to at least get a measure of how dividend policy varies across industries. Using my 95 industry groups as the classification basis, I looked at dividend yields and payout ratios, as well as the proportion of cash returned in buybacks and cash balances, and you can download the data here. While there are many measures on which you can rank industries on dividend policy, I decided to do the rankings based on the cash balances, as a percent of market capitalization, because it is the end result of a lifetime of dividend policy. In the table below, I list the 15 industries that have the lowest cash balances, as a percent of market capitalization, in January 2016.
While this is a diverse listing, most of these industries are in mature businesses, where there is little point to holding cash and one reason for the low cash balances is that many of the companies in these sectors return more cash than they have net income.

At the other end of the spectrum are industries, where cash accumulation is the name of the game. Below, I list the 15 industries (not including financial services, where cash has a different meaning and a reason for being) that had the highest cash balances as a percent of market capitalization.

In a few of these businesses, such as engineering and real estate development, the cash balances may reflect operating models, where the cash will be used to develop properties or on large projects and is thus transitional. There are other businesses, such as auto, shipbuilding and mining, where managers may be using cyclicality (economic or commodity) as a rationale for the cash accumulation. The ratio may also be skewed upwards in highly levered companies, since market capitalization is a smaller percent of overall value in these companies.

Regional Differences
If me-tooism is the driver of why companies in a sector often have similar dividend policies, can it also extend to regions? To examine that question, I started by looking at dividend statistics, by region:
Companies in Australia, Canada and the UK returned more cash collectively, in dividends, than they generated in net income, a reflection of both tax laws that favor dividends and a bad year for commodities (at least for the first two). Japanese companies are cash hoarders, paying the least in dividends and holding on to the most cash. Indian companies are cash poor on every dimension, paying little in dividends and having the least cash, as a percent of market capitalization, of any of the regional groupings. Finally, while much has been made about how much cash has been accumulated at US companies (about $2 trillion), the cash balance, as a percent of market capitalization, is among the  lowest in the world. Absolute values are deceptive, since they will skew you towards the largest markets.

I also computed dividend statistics (dividend yield, cash dividend payout, cash return payout and cash as a percent of market capitalization) by country and plotted them on a heat map:
Note that in some of these countries, the sample sizes are small and the statistics have to be taken with a lot of salt.

The Bottom Line
For both managers and investors, dividends are more than just a return of cash for which companies have no use. Dividends become a divining rod for the company's health, a number that companies stick with through good times and bad and one that has its roots in imitation more than fundamentals. Consequently, companies often get trapped in dividend policies that don't suit them, either paying too much and covering up the deficit with debt and investment cut backs or paying too little and accumulating mountains of cash.
    Share:

    Monday, January 25, 2016

    January 2016 Data Update 6: Debt, the double edged sword!

    In corporate finance, the decision on whether to borrow money, and if so, how much has divided both practitioners and theorists for as long as the question has been debated. Corporate finance, as a discipline, had its beginnings in Merton Miller and Franco Modigliani's classic paper on the irrelevance of capital structure. Since then, theorists have finessed the model, added real life concerns and come to the unsurprising conclusion that there is no one optimal solution that holds across companies. At the same time, practitioners have also diverged, with the more conservative ones (managers and investors) arguing that debt brings more pain than gain and that you should therefore borrow as little as possible, and the most aggressive players positing that you cannot borrow too much.

    The Trade off on debt
    The benefits of debt, for better or worse, are embedded in the tax code, which in much of the world favors borrowers. Specifically, a company that borrows money is allowed to deduct interest expenses before paying taxes, whereas one that is equity funded has to pay dividends out of after-tax earnings. This, of course, makes it hypocritical of politicians to lecture any one on too much debt, but then again, hypocrisy is par for the course in politics. A secondary benefit of debt is that it can make managers in mature, cash-rich companies a little more disciplined in their project choices, since taking bad projects, when you have debt, creates more pain (for the managers) than taking that same projects, when you are an all equity funded company.

    On the other side of the ledger, debt does come with costs. The first and most obvious one is that it increases the chance of default, as failure to make debt payments can lead to financial distress and bankruptcy. The other is that borrowing money does create the potential for conflict between stockholders (who seek upside) and lenders (who want to avoid downside), which leads to the latter trying to protect themselves by writing in covenants and/or charging higher interest rates.

    Pluses of DebtMinuses of Debt
    1. Tax Benefit: Interest expenses on debt are tax deductible but cash flows to equity are generally not. The implication is that the higher the marginal tax rate, the greater the benefits of debt.1. Expected Bankruptcy Cost: The expected cost of going bankrupt is a product of the probability of going bankrupt and the cost of going bankrupt. The latter includes both direct and indirect costs. The probability of going bankrupt will be higher in businesses with more volatile earnings and the cost of bankruptcy will also vary across businesses.
    2. Added Discipline: Borrowing money may force managers to think about the consequences of the investment decisions a little more carefully and reduce bad investments. The greater the separation between managers and stockholders, the greater the benefits of using debt.2. Agency Costs: Actions that benefit equity investors may hurt lenders. The greater the potential for this conflict of interest, the greater the cost borne by the borrower (as higher interest rates or more covenants). Businesses where lenders can monitor/control how their money is being used can borrow more than businesses where this is difficult to do.

    In the Miller-Modigliani world, which is one without taxes, bankruptcies or agency problems (managers do what's best for stockholders and equity investors are honest with lenders), debt has no costs and benefits, and is thus irrelevant. In the world that I live in, and I think you do too, where taxes not only exist but often drive big decisions, default is a clear and ever-present danger and conflicts of interests (between managers and stockholders, stockholders and lenders) abound, some companies borrow too much and some borrow too little.

    The Cross Sectional Differences
    Looking at the trade off, it is clear that 2015 tilted more towards the minus side than plus side of the equation for debt, as the Chinese slowdown and the commodity price meltdown created both geographic and sector hot spots of default risk. As in prior years, I started by looking at the distribution of debt ratios across global companies, in both book and market terms:
    Debt to capital (book) = Total Debt/ (Total Debt + Book Equity)
    Debt to capital (market) = Total Debt/ (Total Debt + Market Equity)
    In keeping with my argument that all lease commitments should be considered debt, notwithstanding accounting foot dragging on the topic, I include the present value of lease commitments as debt, though I am hamstrung by the absence of information in some markets. I also compute net debt ratios, where I net cash out against debt, for all companies:
    Damodaran Online
    While debt ratios provide one measure of the debt burden at companies, there are two other measures that are more closely tied to companies getting into financial trouble. The first is the multiple of debt to EBITDA, with higher values indicative of a high debt burden and the other is the multiple of operating income to interest expenses (interest coverage ratio), with lower values indicating high debt loads. In 2015, the distribution of global companies on each of these measures is shown below:

    By itself, there is little that you can read into this graph, other than the fact that there are some companies that are in danger, with earnings and cash flows stretched to make debt payments, but that is a conclusion you would make in any year.

    The Industry Divide
    To dig a little deeper into where the biggest clusters of companies over burdened with debt are, I broke companies down by industry and computed debt ratios (debt to capital and debt to EBITDA) by sector. You can download the entire industry data set by clicking here, but here are the 15 sectors with the most debt (not counting financial service firms), in January 2016.
    Damodaran Online, January 2016
    There is a preponderance of real estate businesses on this list, reflecting the history of highly levered games played in that sector. There are quite a few heavy investment businesses, including steel, autos, construction shipbuilding, on this list. Surprisingly, there are only two commodity groups (oil and coal) on this section, oil/gas distribution, but it is likely that as 2016 rolls on, there will be more commodity sectors show up, as earnings lag commodity price drops.

    In contrast, the following are the most lightly levered sectors as of January 2016.
    Damodaran Online, January 2016
    The debt trade off that I described in the first section provides some insight into why companies in these sectors borrow less. Notice that the technology-related sectors dominate this list, reflecting the higher uncertainty they face about future earnings. There are a few surprises, including shoes, household products and perhaps even pharmaceutical companies, but at least with drug companies, I would not be surprised to see debt ratios push up in the future, as they face a changed landscape.

    The Regional Divides
    If the China slow-down and the commodity pricing collapse were the big negative news stories of 2015, it stands to reason that the regions most exposed to these risks should also have the most companies in debt trouble. The regional averages as of January 2016 are listed below:
    Damodaran Online, Data Update of 41,889 companies in January 2016
    The measure that is most closely tied to the debt burden is the Debt to EBITDA number and that is what I will focus on in my comparisons. Not surprisingly, Australia, a country with a disproportionately large number of natural resource companies, tops the list and it is followed closely by the EU and the UK.  Canada has the highest percentage of money-losing companies in the world, again due to its natural resource exposure. The companies listed in Eastern Europe and Russia have the least debt, though that may be due as much to the inability to access debt markets as it is to uncertainty about the future. With Chinese companies, there is a stark divide between mainland Chinese companies that borrow almost 2.5 times more than their Hong Kong counterparts. If you are interested in debt ratios in individual countries, you can see my global heat map below or download the datasets with the numbers.


    If the biggest reason for companies sliding into trouble in 2015 were China and Commodities, the first three weeks of 2016 have clearly made the dangers ever more present. As oil prices continue to drop, with no bottom in sight, and the bad news on the Chinese economy continue to come out in dribs and drabs, the regions and sectors most exposed to these risks will continue to see defaults and bankruptcies. These, in turn, will create ripples that initially affect the banks that have lent money to these companies but will also continue to push up default spreads (and costs of debt) for all firms. 

    The Bottom Line
    Debt is a double edged sword, where as you, as the borrower, wield one edge against the tax code and slice your taxes, the other edge, just as sharp, is turned against you and can hurt you, in the event of a downturn. In good times, companies that borrow reap the benefits of debt, slashing taxes paid and getting rewarded with high values by investors, who are just as caught up in the mood of the moment. In bad times, which inevitably follow, that debt turns against companies, pushing them into financial distress and perhaps putting an end to their existence as ongoing businesses.  One constraint that I will bring into my own investments decisions in 2016 is a greater awareness of financial leverage, where in addition to valuing businesses as going concerns, I will also look at how much debt they owe. I will not reflexively avoid companies that have borrowed substantial amounts, but I will have to realistically assess how much this debt exposes them to failure risk, before I pull the "buy" trigger.

    Datasets
    1. Debt Ratios, by sector (January 2016)
    2. Debt Ratios, by country (January 2016)

    Share:

    Wednesday, January 20, 2016

    January 2016 Data Update 5: Making a case for corporate governance

    In my last post, I looked at the cost of capital, a measure of what it costs firms to raise capital. That capital, if put to good use by businesses, should earn returns higher than the costs to generate value. Simply put, the end game in business is not just to make money but to make enough to cover a risk-adjusted required return. In publicly traded companies, it is managers at these companies, for the most part, who are investing the capital that comes from stockholders and bondholders (or banks), and corporate governance is a measure of whether these managers are being held accountable for their investment decisions.

    Defining a good investment
    It is true that there are differences of opinion about how best to measure the cost of raising funds, but disagreements about the cost of capital are drowned out by disputes on how best to measure the returns that are generated by investing this capital. There are two widely used proxies for profitability. One is the profit margin, obtained by dividing the earnings by the revenues of the firm, and it can be estimated using either operating income (operating margin) or net income (net margin). Since the latter is a function of both the profitability of businesses and how much they have chosen to borrow, I will focus on operating margins and report on the distribution of both pre-tax and after-tax operating margin in the graph below:
    Source: Damodaran Online
    The second measure of profitability, and perhaps the more useful one in the context of measuring the quality of an investment, is obtained by scaling the operating earnings to the capital invested in a project or assets to estimate a return on invested capital. The capital invested is usually computed by aggregating the book values of debt and equity in a business and netting out the cash. The resulting return on invested capital can be compared to the cost of capital to arrive at the excess return (positive or negative) earned by a firm. In the figure below, I look at the mechanics of the return on capital computation in the picture below.

    Note the caveats that I have added  to the picture, listing the perils of trusting two accounting numbers: operating income and invested capital. I did try to correct for the accounting misclassifications, converting leases into debt and R&D into capital assets, and also computed an alternate return on capital measure, based on average earnings over the last ten years. Notwithstanding these adjustments, I am still exposed to a multitude of accounting problems and I have to hope and pray that the law of large numbers will bail me out on those.

    I computed the return on invested capital for each of the 41,889 firms in my sample and subtracted out the cost of capital for each one to arrive at an excess return. The graph below captures the distribution of this excess return across global firms in 2015:

    Overall, more than half of all publicly traded firms, listed globally, earned returns on capital that were lower than the cost of capital in 2015 and this conclusion is not sensitive to using average income or my adjustments for R&D and leases. The return on capital is a flawed measure and I have written about the adjustments that are often needed to it. That said, with the corrections for leases and R&D, it remains the measure that works best across businesses in capturing the quality of investments.

    Industry Excess Returns
    In the second part of the analysis, I broke down the 41,889 companies into 95 industry grouping and computed the excess returns for each industry group.  The full results are at this link, but I ranked companies based on the magnitude of the excess returns. Again, with all the reservations that you can bring into this measure of investment quality, the businesses that delivered the highest spreads (over and above the cost of capital) are listed below.


    The best-performing sector is tobacco, where companies collectively earned a return on capital almost 22% higher than the cost of capital. One potential problem is that many of the businesses on this list also happen to be asset-light, at least in the accounting sense of the word, and some of these returns may just reflect our failure to fully capitalize assets in these businesses.

    Looking at the other end of the spectrum, the following is a list of the worst performing businesses in 2015, based on returns generated relative to the cost of capital.

    Note that oil companies are heavily represented on this list, not surprising given the drop in oil prices during the year. That, of course, does not make them bad businesses since a turning of the commodity price cycle will make the returns pop. There are other businesses that have been affected by either the slowing down of the China growth engine, such as steel and shipbuilding, and the question is whether they can bounce back if Chinese growth stays low. Finally, there are some perennially bad businesses, with auto and truck being one that has managed to stay on this list every year for the last decade, grist for my post on bad businesses and why companies stay in them.

    In computing this excess return, I deliberately removed financial service firms from the mix, because computing operating income or invested capital is a difficult, if not impossible task, at these firms. Lest you feel that I am giving managers at these firms a pass on the excess return question, I would replace the excess return spread (ROIC - Cost of capital) with an equity excess return spread (ROE - Cost of Equity) for these companies.

    Regional Differences
    Are firms in some parts of the world  better at putting capital to work than others? To answer that question, I broke my global sample into sub-regions and computed both operating margins and excess returns (return on invested capital, netted out against cost of capital) in each one.


    Looking at the list, the part of the world where companies seem to have the most trouble delivering their cost of capital is Asia, with Chinese companies being the worst culprits and India being the honorable exception. US and UK companies do better at delivering returns that beat their hurdle rates than European companies.

    Again, I would be cautious about reading too much into the differences across regions, since they may be just as indicative of accounting differences, as they are of return quality. It is also possible that some of the regions might have a tilt towards industries that under performed during the year and their returns will reflect that. Thus, the excess returns in Australia and Canada, which have a disproportionate share of natural resource companies, may be reflecting the drubbing that these companies took in 2015. 

    A Case for Corporate Governance
    I have been doing this analysis of excess returns globally, each year for the last few, and my bottom line conclusions have stayed unchanged.
    1. The value of growth: If the value of growth comes from making investments that earn more than your hurdle rate, growth in a typical publicly traded company is more likely to destroy value than to increase value (since more than 50% of companies earn less than their cost of capital). For investors and management teams in companies, I would view this as a signal to not rush headlong into the pursuit of growth.
    2. Bad management stays bad: In my sample, there are firms that have been earning excess returns year after year for most of the last decade, casting as a lie any argument that managers at these firms might make about "passing phases" and "bad years" affecting the numbers. To the question of why these managers continue to stay on, the answer is that in many parts of the world, it is almost impossible to dislodge these managers or even change how they behave.
    3. Bad businesses: There are entire businesses that have crossed the threshold from neutral to bad businesses, but management seems to be in denial. These are the businesses that I have described in my corporate life cycle posts as the "walking dead" companies and I have explored why they soldier on, often investing more into these investing black holes.
    Is good corporate governance the answer to these problems? In much of the world, the notion that stockholders are part owners of a company is laughable, as corporations continue to be run as if they were private businesses or family fiefdoms, and politics and connections, not stockholder interests,  drive business decisions in others.. Even in countries like the United States, where there is talk of good corporate governance, it has become, for the most part, check-list corporate governance, where the strength of governance is measured by how many independent directors you have and not by how aggressively they confront managers who misallocate capital. Institutional investors have been craven in their response to managers, not just abdicating their responsibility to confront managers, where needed, but actively working on behalf of incumbent managers to fight off change. The sorry record of value creation at publicly traded companies around the globe should act as a clarion call for good corporate governance. In the words of Howard Beale, from Network, we (as stockholders) should be "mad as hell and should not take it any more".

    1. Paper on measuring ROIC, ROC and ROE (Warning: Extremely boring but could be cure for amnesia. Don't read for excitement value!)

    Share:

    Monday, January 18, 2016

    Chelsea - Accidents Will Happen


    After such a successful 2014/15 when they won the Premier League and Capital One Cup, very few people would have expected Chelsea to fall off the rails so spectacularly this season. However, a combination of key players losing form and manager José Mourinho struggling to find a solution, not to mention the distasteful Eva Carneiro episode, led to a string of defeats and ultimately the departure of the “Special One”.

    Guus Hiddink has been installed as interim manager until the end of the season with the club hoping he can repeat the achievements of his previous stint in that role or at the very least drive the club up the table and avoid the unthinkable threat of relegation.

    Although 2014/15 brought two trophies to Stamford Bridge, the news was not so good off the pitch, as the previous year’s £19 million profit was transformed into a £23 million loss – a deterioration of £42 million.


    This was driven by two main factors: (a) profit on player sales fell £23 million from £65 million to a still impressive £42 million, principally due to the sale of Romelu Lukaku to Everton, Andre Schurrle to Wolfsburg, Ryan Bertrand to Southampton and Thorgan Hazard to Monchengladbach; (b) the wage bill shot up £23 million (12%) to £216 million, the highest in the Premier League, which might be considered the price of success, as it included hefty bonus payments.

    Revenue fell £6 million to £314 million, largely due to a £4 million decrease in broadcasting revenue to £136 million, as the increase in Premier League distributions was more than offset by not progressing so far in the Champions League. Commercial income was slightly lower at £108 million, while match day was largely unchanged at £71 million.

    Other expenses rose £7 million (10%) to £83 million, while there was a £3 million net increase in exceptional items, as this year’s figures included a £1 million loss on the disposal of investments, while last year’s accounts featured a £2 million credit for the release of a provision for compensation payments following a change in management.

    The only area that improved profitability was non-cash flow expenses, as Chelsea booked a £19 million impairment charge against player values last year, while player amortisation was £3 million lower at £69 million.


    Chelsea’s £23 million loss is likely to be one of the worst financial performances in England’s top flight in 2014/15. To date, nine Premier League clubs have published their accounts for last season with six reporting profits, the largest being Arsenal £25 million, Southampton £15 million and Manchester City £10 million. Manchester United and Everton have also announced losses, but much lower at around £4 million.

    Although football clubs have traditionally lost money, the increasing TV deals allied with Financial Fair Play (FFP) mean that the Premier League these days is a largely profitable environment with only five clubs losing money in 2013/14.


    As we have seen, once-off profits on player sales can also be very important to the bottom line, especially at Chelsea, where the 2013/14 numbers were boosted by £65 million from this activity, which was only surpassed by Tottenham’s £104 million, almost entirely due to the record sale of Gareth Bale to Real Madrid.

    Chelsea’s huge profit that season was largely due to the sales of David Luiz to Paris Saint-Germain, Juan Mata to Manchester United and Kevin De Bruyne to Wolfsburg.


    Of course, Chelsea are no strangers to making losses in the Abramovich era, as they have invested substantially to first build a squad capable of winning trophies and then to keep them at the top of the pile. Since the Russian acquired the club in June 2003, it has reported aggregate losses of £684 million, though there has been much improvement after the spectacular £140 million loss in 2005 with Chelsea posting profits in two of the last four years.

    The first profit made under the Abramovich ownership was a small £1 million surplus in 2012, though this owed a lot to £18 million profit arising from the cancellation of preference shares previously owned by BSkyB.


    On the other hand, Chelsea have consistently suffered from so-called exceptional items, which have increased costs by £127 million since 2005, due to compensation paid to dismissed managers £61 million, impairment of player registrations £28 million, the early termination of a former shirt sponsor £26 million, tax on image rights £6 million, the impairment of other fixed assets £5 million and loss on disposal of investments £1 million.

    That’s an average of around £12 million year, but was particularly relevant in 2011, when £41 million of exceptionals “had a significant impact on the size of the losses”. Next year’s accounts will again be hit by Mourinho’s pay-off. Although this has been reported as various sums, most sources suggest that this will be restricted to one year’s salary, even though he signed a new four-year contract last summer, but that would still amount to £9-10 million.


    However, it is profit from player sales that is having an increasing influence on Chelsea’s figures. In the seven years between 2005 and 2011, Chelsea averaged £10 million profit from selling players, but this has shot up to an average of £38 million in the four years since then.

    In particular, Chelsea’s figures have benefited from £107 million from player sales in the last two seasons. Their reliance on this activity is underlined by the fact that they would have made a loss of £46 million in 2014 instead of a £19 million profit without these transfers.

    Chelsea noted that six players had been sold at a profit of £21 million since the latest accounts closed, including Petr Cech to Arsenal, Filipe Luis to Atletico Madrid and Oriol Romeu to Southampton. They also received £6 million in respect of sell-on clauses for players transferred in previous years.

    "This Cesc is not on fire"

    This is clearly lower than the last two years, though there could still be more to come in the January transfer window, e.g. Juventus are rumoured to want to make Juan Cuadrado’s loan deal permanent.

    Chelsea’s extensive use of the loan system is also noteworthy with around 30 players currently listed as being out on loan, including four at Dutch club Vitesse Arnhem, which appears to be an unofficial feeder club.

    Given that very few of these players have succeeded in establishing themselves in Chelsea’s first team, it would appear that the primary purpose of this strategy is to develop players for future (profitable) sales, while effectively placing them in the shop window.

    "John, I'm only dancing"

    Some of the player wages will be covered by the loanees’ clubs, though it is likely that Chelsea would still have to pay a fair amount, but from a financial perspective the real gains arise after the player is sold. Clearly, not every player will bring in big money, but this approach only needs a couple of lucrative sales to be successful. The pipeline of probable upcoming sales includes the likes of Mo Salah, Victor Moses and Marko Marin.

    Although some might complain that this smacks of treating players like stocks and shares, not to mention ensuring that rival clubs cannot buy this promising talent, there are (currently) no rules against it and other clubs, such as Udinese, have operated in a similar way for many years.

    It remains to be seen whether more academy players make it at Chelsea, though there are high hopes for Ruben Loftus-Cheek, Nathan Aké, Dominic Solanke, Lewis Baker and Izzy Brown.


    The other side of player trading is obviously player purchases, which is reflected in the profit and loss account via player amortisation. To illustrate how this works, if Chelsea paid £25 million for a new player with a five-year contract, the annual expense would only be £5 million (£25 million divided by 5 years) in player amortisation (on top of wages).

    However, when that player is sold, the club reports the profit as sales proceeds less any remaining value in the accounts. In our example, if the player were to be sold 3 years later for £32 million, the cash profit would be £7 million (£32 million less £25 million), but the accounting profit would be £22 million, as the club would have already booked £15 million of amortisation (3 years at £5 million).


    The accounting for player trading is fairly tedious, but it is important to grasp how it works to really understand a football club’s accounts. The fundamental point is that when a club purchases a player the costs are spread over a few years, but any profit made from selling players is immediately booked to the accounts, which helps explain why it is possible for clubs like Chelsea and Manchester City to spend so much and still meet UEFA’s FFP targets.

    Chelsea’s initial wave of purchases under Abramovich saw player amortisation shoot up to £83 million in 2005, before falling away to £38 million in 2010 in line with less frenetic transfer activity. As spending kicked in again, player amortisation steadily rose to £72 million in 2014, before falling back to £69 million in 2015.


    Unsurprisingly, this is still one of the highest player amortisation charges in the Premier League, only surpassed by Manchester United, whose massive outlay under Moyes and van Gaal has driven their annual expense up to £100 million, and Manchester City £70 million.

    The value of Chelsea’s squad on the balance sheet fell slightly to £223 million in 2015, though this understates how much they would fetch in the transfer market, not least because homegrown players are ascribed no value in the books. Chelsea are one of the few clubs to formally acknowledge this factor in the accounts, as they have valued the playing staff at £350 million.


    As a result of all this accounting smoke and mirrors, clubs often look at EBITDA (Earnings Before Interest, Depreciation and Amortisation) for a better idea of underlying profitability. In Chelsea’s case this metric highlights their recent improvement, as it is has been positive for the last three years, though it did fall from the £51 million peak in 2014 to £16 million in 2015.


    However, to place that into context, this is way behind Manchester United £120 million, Manchester City £83 million and Arsenal £64 million. In fact, United’s amazing ability to generate cash is reflected in their projected EBITDA of £165-175 million for 2015/16 following their return to the Champions League and their new kit deal.


    Despite slipping back in 2015, Chelsea have increased their revenue by 52% (£108 million) since 2009 from £206 million to £314 million. The growth is split evenly between commercial income, which has roughly doubled from £55 million to £108 million, and broadcasting income, which has increased 71% (£56 million) from £79 million to £136 million.

    Match day receipts have actually fallen from £75 million to £71 million, as this is linked to the number of home games played, which were lower due to not progressing so far in the Champions League. As the club noted, “all three sources of income are dependent on the performance of the first team.”


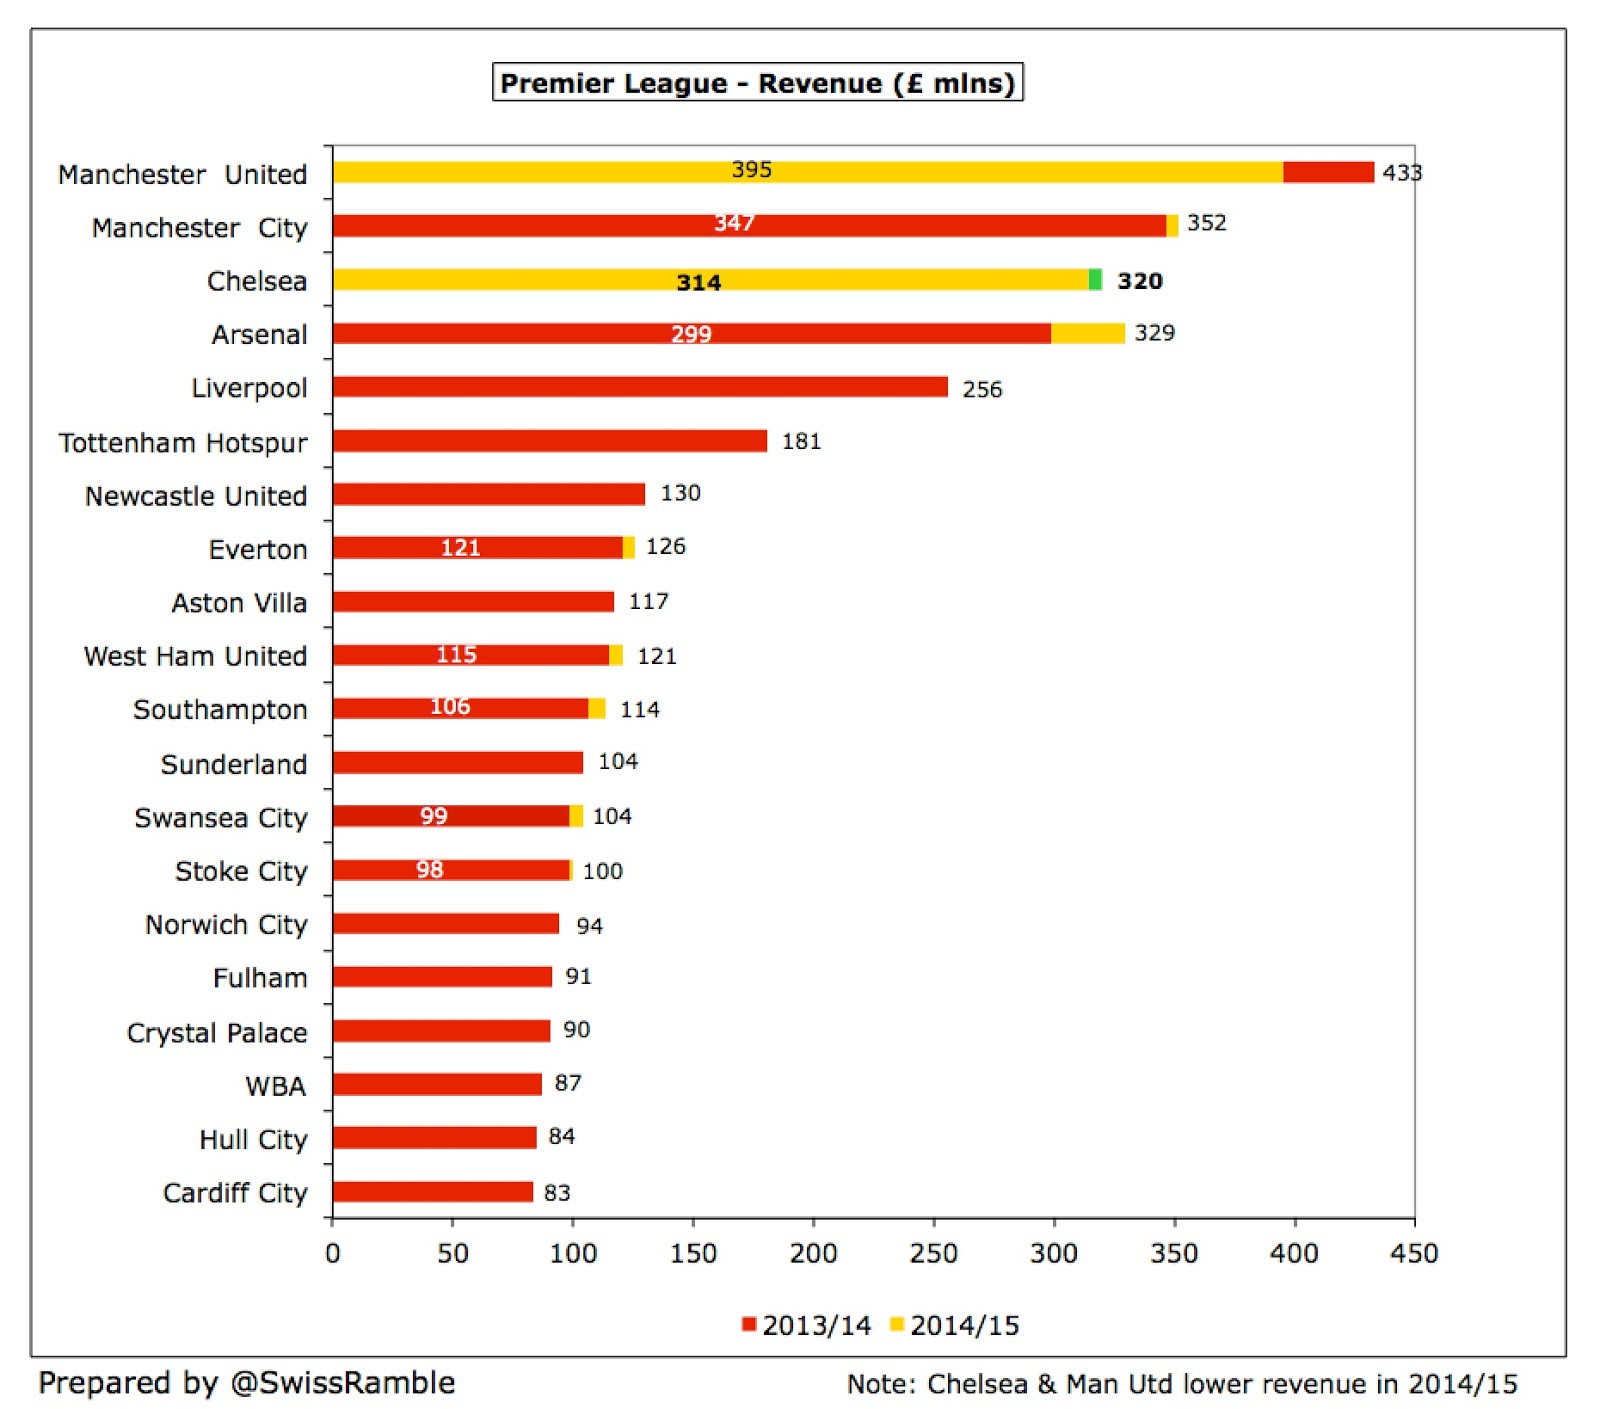
    In terms of revenue, Chelsea were overtaken by Arsenal in 2014/15, so now have the fourth highest in England, behind Manchester United £395 million, Manchester City £352 million and the aforementioned Arsenal £329 million.

    This performance was defended by chairman Bruce Buck: “To record the second-highest turnover figure in the club’s history, despite the Champions League campaign ending at the earliest knockout round, demonstrates our business is robust and is testament to good work regarding our commercial activities, our growing fan base around the world and the tremendous support the team received at home and away matches in 2014/15.”


    However, the lack of growth was disconcerting, especially as Arsenal grew by 10% (£31 million) last season. Even though City’s growth was only 2% (£5 million), this was obviously preferable to Chelsea’s 2% (£6 million) decline. Manchester United’s 9% (£38 million) decrease was due to their failure to qualify for Europe.

    In fairness to Chelsea’s executive team, 2015/16 will again see a rise in revenue, as the club observed, “Following our Premier League championship-winning season, we expect the current year to produce record revenues once again. These will be powered by new commercial deals, including our record-breaking partnership with Yokohama, and revenues related to this season's Champions League which improve due to entering as Premier League champions and an increase in TV revenue for English clubs.”


    Chelsea’s 2013/14 revenue of £324 million (based on the holding company accounts) placed them 7th highest in world football as per the Deloitte Money League, though Real Madrid continued to lead the way with £460 million, followed by Manchester United £433 million, Bayern Munich £408 million, Barcelona £405 million and Paris Saint-Germain £397 million.

    The gap to the top is likely to increase in the next edition, as both Spanish giants have announced good revenue growth in 2014/15: Real Madrid up 5% to €578 million, Barcelona up 16% to €561 million. Against that, their revenue in Sterling terms will be impacted by the weakness of the Euro.

    Furthermore, United are estimating revenue of £500-510 million in 2015/16 following their return to the Champions League and the record Adidas kit deal, which would make them the first English club to break through the half-billion pounds barrier.


    If we compare Chelsea’s revenue to that of the other nine clubs in the Money League top ten, we can immediately see where their largest problem lies, namely commercial income, where Chelsea are substantially lower than their rivals that have traditionally been more successful in monetising their brand: Bayern Munich £131 million (£244 million minus £113 million), Real Madrid £80 million and Manchester United £76 million. The £161 million shortfall against PSG is largely due to the French club’s “friendly” agreement with the Qatar Tourist Authority.

    On the plus side, Chelsea look to be fine on broadcasting and not too bad on match day income, though there is room for improvement in the latter category.


    Despite the fall in broadcasting revenue, this still accounts for the largest share of Chelsea’s revenue, though this fell from 44% to 43%. Commercial was unchanged at 34%, while match day rose slightly to 23%.


    Chelsea’s share of the Premier League television money rose £5 million from £94 million to £99 million in 2014/15, largely due to higher merit payments for winning the league, as opposed to finishing third the previous season. This is likely to fall this season, as Chelsea will finish in a lower place.

    However, there will be a substantial increase from the mega Premier League TV deal starting in 2016/17. My estimates suggest a place in the top four would be worth an additional £50 million under the new contract. This is based on the contracted 70% increase in the domestic deal and an assumed 30% increase in the overseas deals (though this might be a bit conservative, given some of the deals announced to date).


    The other main element of broadcasting revenue is European competition with Chelsea receiving €39 million for reaching the last 16 in the Champions League, compared to €43 million for getting to the semi-final the previous season. The reduction was higher in Sterling terms, due to the weakening of the Euro. Of course, Chelsea’s European revenue peaked in 2011/12 when they beat Bayern Munich in a dramatic final to win the Champions League.

    Here, it is worth noting the importance of the TV (Market) pool to the Champions League distributions. First of all, there was more money available in the UK market pool in 2014/15, as this did not have to be shared with a Scottish club (as was the case in 2013/14 with Celtic). Second, the allocation also depends on how many clubs reach the group stage from a country, which explains why Juventus received such an enormous slice of the Italian market pool, as they only had to share it with one other club, while the UK pool was split between four clubs.


    Finally, half of the distribution is based on how far a club progresses in the Champions League, while the other half depends on where a club finished in the previous season’s Premier League: 1st place 40%, 2nd place 30%, 3rd place 20% and 4th place 10%. As Chelsea won the title in 2014/15, compared to finishing third the year before, they will receive a higher percentage in 2015/16.

    The financial significance of a top four placing is even more pronounced from the 2015/16 season with the new Champions League TV deal worth an additional 40-50% for participation bonuses and prize money and further significant growth in the market pool thanks to BT Sports paying more than Sky/ITV for live games.

    If Chelsea fail to qualify for Europe’s flagship tournament (for the first time under Abramovich), their revenue would be hit to the tune of at least £40 million (including gate receipts and sponsorship clauses).


    Match day income was largely unchanged at £71 million with the number of home games staged remaining at 26 (2 more in the League Cup, 2 fewer in the Champions League). This revenue stream peaked at £78 million in 2011/12, thanks to the victories in the Champions League and the FA Cup.

    Admirably, Chelsea have held ticket prices at 2011/12 levels for five consecutive seasons and this year introduced a new price bracket for U20s. In fact, Bruce Buck confirmed, “This is the eighth time in 10 seasons there has been no increase in the cost of general admission tickets at Stamford Bridge.”

    Chelsea’s match day revenue is £20-30 million lower than Arsenal and Manchester United, as they have much bigger grounds, which helps explain why the club has spent so much time searching nearby locations for a new stadium. However, they were outbid for the Battersea Power Station and have ruled out moves to Earls Court and White City.


    Instead, Chelsea have now submitted a planning application to increase the capacity of Stamford Bridge from 41,600 to 60,000. This would be a complex build with the plan being to lower the arena into excavated ground, but the estimated £500 million cost would be funded by Abramovich.

    The hope would be to start work in 2017 with Chelsea having to find a temporary home for three years. The club is in discussions with the Football Association to play at Wembley (as are Tottenham who are also planning a stadium move), though Twickenham, the headquarters of the Rugby Football Union, has also been mentioned as a possibility. This would cost around £15 million a year, though income might be higher if the crowds increased.

    Chelsea have previously highlighted “the need to increase stadium revenue to remain competitive with our major rivals, this revenue being especially important under FFP rules.” More corporate hospitality in particular could deliver significant additional revenue with additional potential revenue from naming rights or other sponsorship opportunities.


    Commercial revenue fell slightly by £1 million to £108 million, which was disappointing, especially as they are the only Premier League club to date to report a decrease in this revenue category in 2014/15. It was still higher than Arsenal £103 million and Liverpool £104 million (2013/14 figure), but it was a long way below Manchester United £196 million and Manchester City £173 million.


    Over the last three years Chelsea’s commercial income has grown by 61% (£41 million), which would be considered pretty impressive were it not for Arsenal growing by 97% (£51 million) and Manchester United 67% (£79 million) in the same period.

    However, Chelsea’s commercial revenue will increase in the next set of accounts, as the five-year shirt sponsorship deal with Yokohama tyres started this season. This is worth £40 million a year, i.e. more than double the £18 million previously paid by Samsung. This is on top of the Adidas kit supplier deal, which was extended in 2013 to 2023, which increased the annual payment from £20 million to £30 million.


    Buck specifically noted that “our program of partnering with world-renowned and innovative market leaders is accelerating”, as seen by a deal with Carabao, a leading energy drink company in Thailand, to sponsor training wear from 2016/17 for a reported figure of £10 million a year.

    These deals will leave Chelsea only behind Manchester United for the main shirt sponsorship and kit supplier deals and it’s difficult to compete with their massive Chevrolet and Adidas agreements.


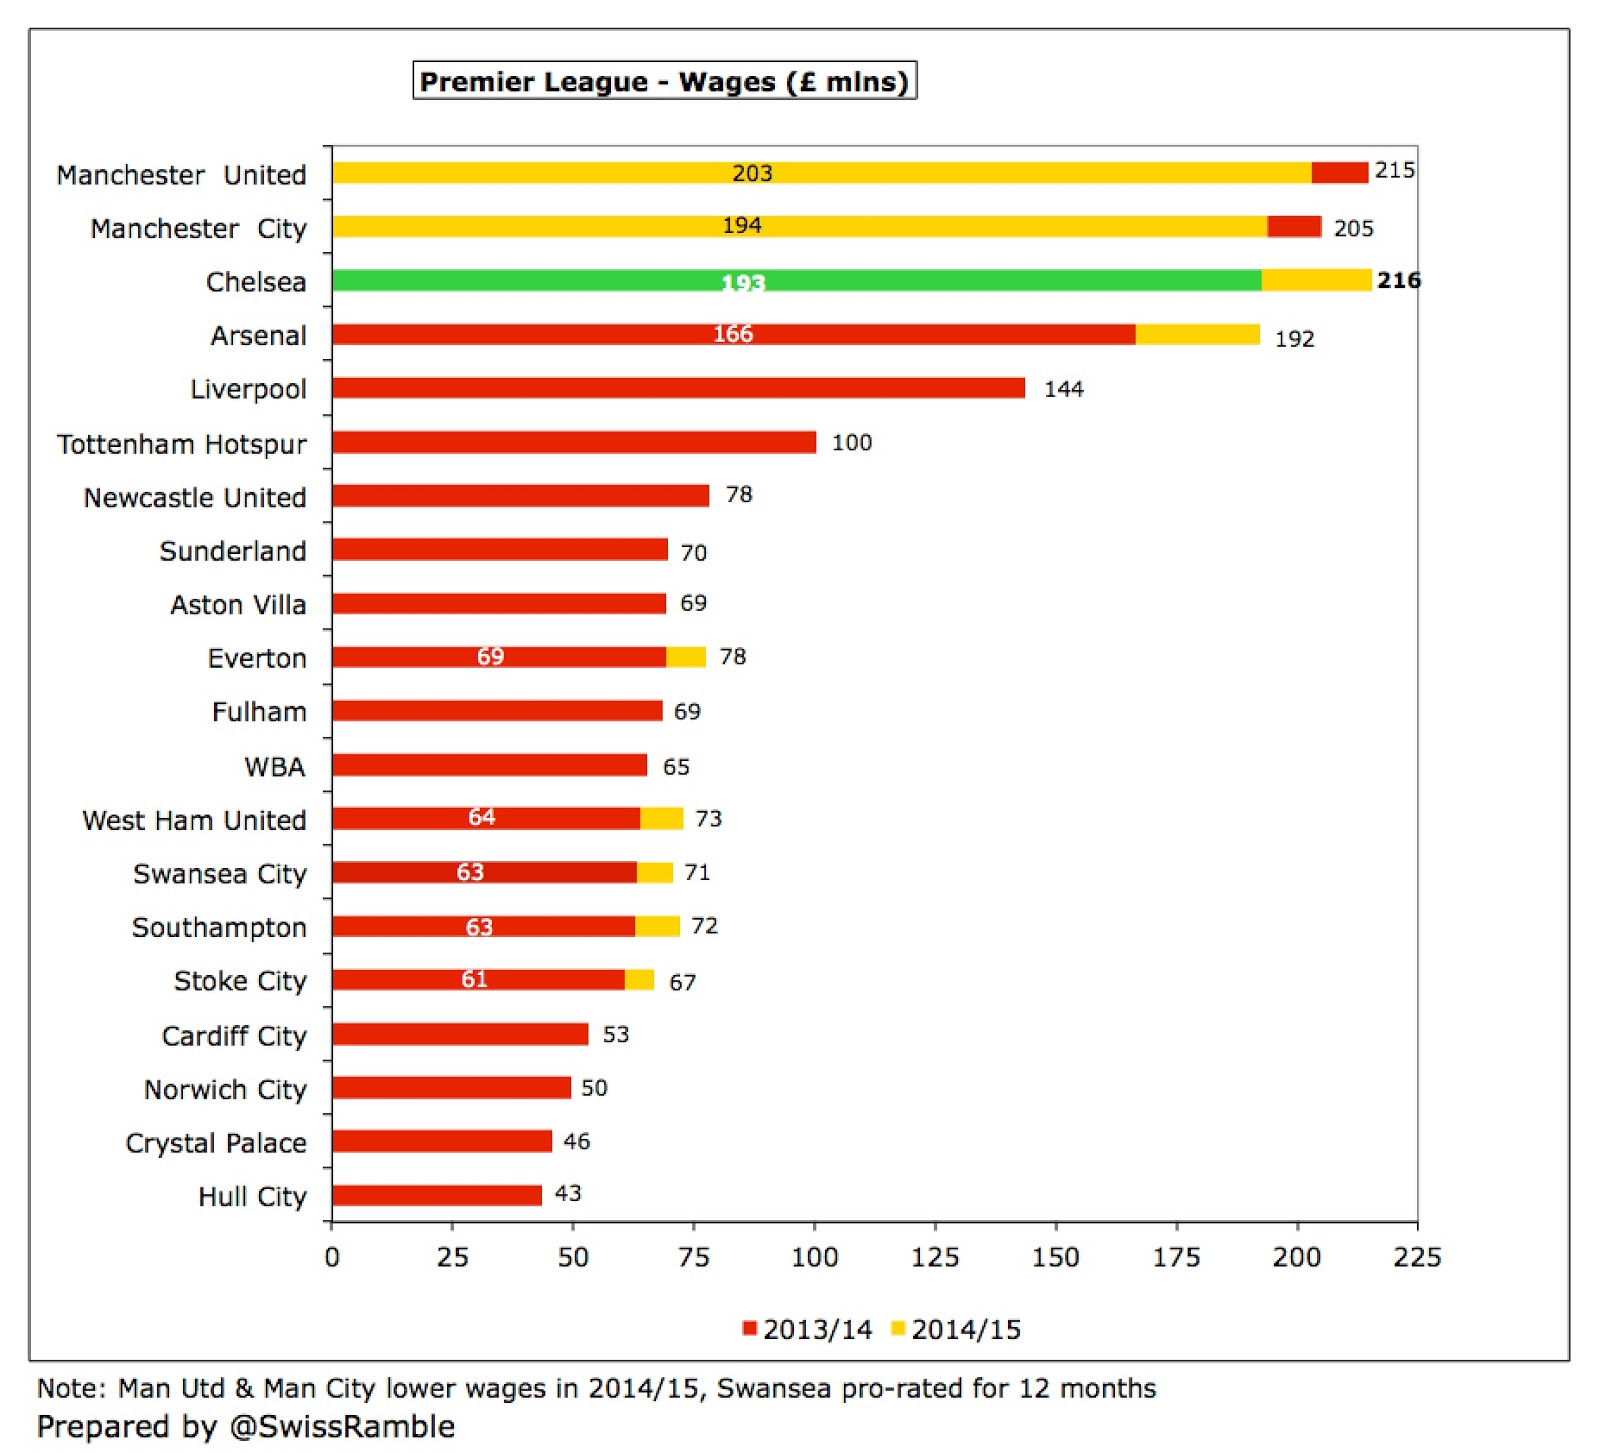
    Wages surged by £23 million (12%) from £193 million to £216 million, reflecting bonuses paid for winning the Premier League and Capital One Cup. This means that the wage bill has risen by £43 million (25%) in the last two years.

    As a technical aside, note that these wage figures have been corrected for exceptional items, e.g. in 2013/14 the reported staff costs of £190.6 million included a £2.1 million credit for the release of a provision for compensation for first team management changes, so the “clean” wage bill was £192.7 million.


    The accounts also include a £1.5 million payment to a director for compensation for loss of office. He is not named, but this is likely to be Ron Gourlay, who resigned in October 2014.

    All this increased the wages to turnover ratio from 60% to 69% following the slight revenue decline in 2014/15, thus reversing the trend of this ratio improving every year from the recent 82% peak in 2010. Although the wages to turnover ratio tends to worsen in the second year of the Premier League TV deal, Chelsea’s is still one of the highest with only West Brom, Fulham and Sunderland reporting worse ratios (previous season’s figures).


    So Chelsea once again have the highest wage bill in the top flight at £216 million, which is the first time since 2010. This is well ahead of Manchester United £203 million, Manchester City £194 million and Arsenal £192 million. There is then a big gap to the other Premier League clubs with the nearest challengers (in 2013/14) being Liverpool £144 million, Tottenham £100 million and Newcastle £78 million.

    This reflects Chelsea’s stated strategy: “In order to attract the talent which will continue to win domestic and European trophies and therefore drive increases in our revenue streams, the football club continually invests in the playing staff by way of both transfers and wages.” This ambitious approach would explain why the club has not seen fit to insert relegation clauses in the players’ contracts, as the club has finished no lower than sixth in Abramovich’s time.


    Both Manchester clubs saw reduction in wages in 2014/15. United’s decrease was due to their lack of success on the pitch, as bonuses fell, while City’s is partly due to a group restructure, where some staff are now paid by group companies, which then charge the club for services provided.


    Although there is a natural focus on wages, other expenses also account for a considerable part of the budget at leading clubs, especially at Chelsea where these rose £7 million (10%) from £76 million to £83 million. This means that Chelsea also top this particular league table, ahead of Manchester City £76 million, Manchester United and Arsenal (both £72 million)

    Other expenses exclude wages, depreciation, player amortisation and exceptional items. They cover the costs of running the stadium, staging home games, supporting commercial partnerships, travel, medical expenses, insurance, retail costs, etc.


    Chelsea’s activity in the transfer market is interesting. For the four years up to 2010 Chelsea only had average gross spend of £25 million (net spend being just £2 million), but they then returned to spending big, averaging £94 million of gross spend in the last six years. In the last two seasons alone they spent £186 million bringing in new players, including Diego Costa, Cesc Fabregas, Juan Cuadrado, Pedro, Baba Rahman, Filipe Luis and Loic Remy.

    However, there is a big difference in net spend. The average annual net spend between 2010 and 2014 was £67 million, but this has fallen to only £20 million for the last two years, thanks to equally big money sales, which did not exactly ease Mourinho’s frustrations.


    It may be a surprise to some, but Chelsea’s total net spend of £40 million in the last two years was only mid-table. Not only were they over £100 million behind the Manchester clubs (City £151 million, United £145 million), but they were also outspent by the likes of West Ham, West Brom and Crystal Palace in this period.

    Chelsea have no financial debt in the football club, as this has all been converted into equity by issuing new shares. That said, the club’s holding company, Fordstam Limited, does have over £1 billion of debt (£1,041 million as of June 2014) in the form of an interest-free loan from the owner, theoretically repayable on 18 months notice.


    Not that it makes much difference, given Abramovich’s willingness to continue to fund the club, but Chelsea noted in the accounts that they had acquired eight players at an initial cost of £69 million this summer. There were also minimal contingent liabilities of £1.5 million, suggesting that Chelsea, unlike most football clubs, pay all their transfer fees upfront, which must be an advantage in negotiations compared to other clubs that have to pay in stages.

    Other clubs have to carry the burden of sizeable debt, notably Manchester United who still have £411 million of borrowings even after all the Glazers’ various re-financings and Arsenal, whose £234 million debt effectively comprises the “mortgage” on the Emirates stadium.


    The advantage of having a benefactor like Abramovich is demonstrated by the annual interest payments at those clubs: £35 million for United, £13 million for Arsenal. That is money that could be spent on transfers or player wages.

    Although Chelsea’s cash flow from operating activities has turned positive in the last three seasons (after adjusting for non-cash flow items, such as player amortisation and depreciation, plus working capital movements), they still require funding from the owner to cover player purchases and investment in improving facilities at Stamford Bridge and the training ground at Cobham.


    That amounted to £104 million in the last two years: £47 million in 2015 and £57 million in 2014. In fact, since Abramovich acquired the club, he has put around £1 billion into the club, split between £611 million of new loans and £350 million of share capital. In that period £672 million of loans have been converted into share capital.

    Most of this funding has been seen on the pitch with £744 million (77%) spent on net player recruitment, while another £130 million went on infrastructure investment. A further £73 million was required to cover operating losses with £17 million on interest payments (in the early years).


    Given Chelsea’s several years of heavy financial losses, many observers had believed that they would fall foul of FFP, but that has not been the case, as confirmed by Buck: “Chelsea has been consistent in our intention to comply with FFP and it was a primary aim in the past financial year to be one of the clubs with a continuous record of meeting the regulations, which we have achieved.”

    The club has taken advantage of some of the allowable exclusions for UEFA’s break-even analysis, namely youth development, infrastructure and (for the initial monitoring periods) the wages for players signed before June 2010.

    Even though Chelsea are compliant, it is clear that this legislation has been at the forefront of the club’s thinking, hence their focus on earning more commercially. The accounts state: “FFP provides a significant challenge. The football club needs to balance success on the field together with the financial imperatives of this new regime.” In other words, Chelsea cannot simply spend their way out of trouble.

    "Save a prayer"

    Looking ahead, Chelsea’s 2015/16 accounts will benefit from the Yokohama shirt sponsorship (£22 million higher) and more money from the Champions League (new TV deal, market pool benefit of entering competition as Premier League champions). However, they will be hit by the Mourinho pay-off and reduced TV money for a lower Premier League finish (e.g. merit payment difference between 1st and 12th is £14 million). Against that, bonus payments should plummet, which would reduce the wage bill.

    The following season (2016/17) will again be a mixed bag. Not qualifying for Europe would mean a revenue reduction of at least £40 million, though costs would also fall, e.g. staging home games, travel, bonus, etc. There would also be the cost of rebuilding the squad in the image of the new manager, More positively, Chelsea would be boosted by the new Premier League TV deal and the training sponsorship contract.

    "Willian, it was really something"

    Longer term, it will be all about the stadium development at Stamford Bridge, but that is very much future music. Such developments rarely go smoothly, especially in an urban environment, as opposed to a green field site.

    It’s incredible what a difference a year can make: twelve months ago everything looked rosy in Chelsea’s garden, but this season has seen one problem after another. The vast majority of other clubs would still prefer to be in their position, but the Roman empire has looked shakier than at any other period in recent times.


    Nevertheless, it would be a brave man that bet against a Chelsea recovery, though a lot will depend on who arrives as permanent manager in the summer.
    Share:

    Labels

    Blog Archive

    Recent Posts

    Unordered List

    Theme Support