• This is default featured slide 1 title

    Go to Blogger edit html and find these sentences.Now replace these sentences with your own descriptions.This theme is Bloggerized by Lasantha Bandara - Premiumbloggertemplates.com.

  • This is default featured slide 2 title

    Go to Blogger edit html and find these sentences.Now replace these sentences with your own descriptions.This theme is Bloggerized by Lasantha Bandara - Premiumbloggertemplates.com.

  • This is default featured slide 3 title

    Go to Blogger edit html and find these sentences.Now replace these sentences with your own descriptions.This theme is Bloggerized by Lasantha Bandara - Premiumbloggertemplates.com.

  • This is default featured slide 4 title

    Go to Blogger edit html and find these sentences.Now replace these sentences with your own descriptions.This theme is Bloggerized by Lasantha Bandara - Premiumbloggertemplates.com.

  • This is default featured slide 5 title

    Go to Blogger edit html and find these sentences.Now replace these sentences with your own descriptions.This theme is Bloggerized by Lasantha Bandara - Premiumbloggertemplates.com.

Sunday, February 28, 2016

Arsenal - Brass In Pocket


As Arsenal enter the business end of the season, there is still much to play for, even though they are now likely to be eliminated from the Champions League by the mighty Barcelona. The domestic double is still up for grabs with nobody running away with the league, while the Gunners’ recent record in the FA Cup is second to none. However, many supporters are nervous about the team’s ability to finish the job, as the customary spate of injuries has led to a distinct dip in form.

The club’s wonderfully named chairman, Sir Chips Keswick, is keeping the faith: “This has been an unpredictable Premier League season thus far. What is important is that we are in contention and I am sure that we have the resources and ability within the squad to sustain a strong challenge.”

However, the club has not really strengthened the squad in the last two transfer windows. In the summer, they were the only Premier League club not to buy an outfield player, though the arrival of top-class goalkeeper Petr Cech has been an undoubted success. It was much the same in January when Arsenal only signed Egyptian midfielder Mohamed Elneny from Basel.

The fans’ frustration that the club has not fully utilised its spending power has once again been underlined by the publication of Arsenal’s financial results for the six months up to 30 November 2015, which revealed hefty cash balances of £159 million.


This is in line with the £162 million cash at the same time last year, but is lower than the £228 million reported in the annual accounts as at 30 May 2015. This is nothing to worry about, as this is simply due to the usual phasing of cash inflows and outflows with most of a football club’s income coming in the second half of the season. In particular, most season ticket renewals are paid in April and May, so Arsenal’s cash balance will always be at its highest when the annual accounts are prepared.

That said, the current £159 million cash balance is still one of the highest Arsenal have had in their interim accounts: 2011 £115 million, 2012 £123 million, 2013 £143 million and 2014 £162 million.

Everything else being equal, Arsenal’s cash balance will again be significantly higher when the next set of annual accounts is released. Depending on when transfer fee stage payments come due, it should be around the £225-250 million level.


Unsurprisingly, Arsenal have more cash than any other club in world football. Although not every Premier League club has published its accounts for the 2014/15 season, the North London side is clearly in a class of its own with the closet challengers being Manchester United, though their £156 million was still £72 million lower than their London rivals, followed by Manchester City £75 million.

It’s a similar story with the leading continental clubs, all of whom held significantly lower cash than Arsenal in 2015: Real Madrid £84 million, Bayern Munich £78 million, Barcelona £58 million and Juventus £5 million.

While it is advisable to put some money aside for a rainy day, there would have to be a monsoon of biblical proportions to justify Arsenal’s current cash levels. At the end of the 2013/14 season, they actually held 40% of the entire Premier League cash balances. However, the relative value of this cash is diminishing, as other mid-tier clubs are now benefitting from the influx of TV funds, e.g. Crystal Palace and Stoke City have £29 million and £26 million respectively.


Clearly Arsenal have been spending money. In fact, in the last six months the club had a net cash outflow of £69 million, even though they basically only broke-even on operating activities (after adding back non-cash expenditure on player amortisation and depreciation and adjusting for working capital movements). They then spent a net £39 million on player registrations (purchases £47 million less sales £8 million), largely due to stage payments from previous transfers.

They also invested £10 million in infrastructure improvements, notably substantial redevelopment at the London Colney training centre and Youth Academy at Hale End, plus some Emirates enhancements such as LED floodlights.

A further £14 million went on servicing the outstanding debt (loan repayment £8 million, interest £6 million), which is worth remembering whenever any ill informed amateur starts spouting nonsense about Arsenal’s debt being fully repaid. There was also a £5 million corporation tax payment, being the balance of the tax bill on the 2014/15 profits.

It is worth highlighting that Arsenal generated positive cash inflows of around £65 million in the second half of each of the last two seasons to turn around the outflows of the first half of the season, e.g. 2014/15 had a net outflow of £46 million at the interims, but this was converted into a net inflow of £20 million by the end of the year.

"I still haven't found what I'm looking for"

Of course, the raw figure in the accounts is a bit misleading, as not all of this cash balance is available to spend on transfers. Once more, for the cheap seats: not all of the cash balance represents a transfer fund.

In the face of growing criticism, chief executive Ivan Gazidis has emphasised this point: “It is quite untrue that we are sitting on a huge cash pile for some unspecified reason. The vast majority of that cash is accounted for in various ways.”

In fact, the club is so sensitive on this point that last year’s annual accounts noted that “proper consideration” of the cash balance should make deductions for the debt service reserve and the net amount owed on previous player purchases.

The irritating debt service reserve has been required ever since the 2006 bond agreements, though it does raise the question of whether these arrangements could be renegotiated given Arsenal’s significantly better financial position today, thus freeing up this money (£23 million in these accounts, £35 million for the full year).

"Genius of Love"

Like every other football club, Arsenal have not paid all the cash upfront for transfer fees, but have (sensibly) agreed stage payments, so part of the cash balance has to be reserved to pay sums due on those transfers. This has been reduced by £20 million following settlements of some transfer liabilities, but it still stands at £45 million.

As a good economist, manager Arsene Wenger has explained that the club’s relatively low spending is due more to supply and demand than an unwillingness to spend: “It is not a shortage of money, just a shortage of players”, adding that there was “quantity, not quality” in the transfer market. He has a point; though it is disappointing that Arsenal’s scouting network has failed to identify a few decent (available) players somewhere in world football that could improve the squad.

It might be difficult to find value in the market, especially as the prices quoted to Arsenal and other leading English clubs tend to be higher than those for continental clubs, with sellers clearly being aware of the wealth coming from the Premier League TV deals. This may be a little reminiscent of Harry Enfield’s “I saw you coming” sketch, but that’s the reality of the football market today. Clubs like Arsenal need to blow the other clubs out of the water – or there’s simply no point having more money.

"How was it for you?"

The other problem with hoarding cash was noted by no less a person than Sir Chips Keswick, when he spoke of the forthcoming blockbuster Premier League TV deal: “the increased revenues will also very likely bring with them inflationary pressures in terms of both the wage bill and the transfer market.” Exactly – so why not splash the cash before then?

This is exacerbated by, of all things, Brexit, as the Pound has depreciated by around 10% against the Euro in the last few months, thus reducing the spending capacity of English clubs abroad.

Despite all of these factors, there is still substantial money available to spend. It’s clearly not as much as the figure in the books, but we can say with some conviction that Arsenal should have around £100 million to spend in the summer on improving the squad.


Nonetheless, it should be acknowledged that Arsenal have been spending more in the transfer market in the past few seasons. For example, it might come as a surprise to Arsenal fans that they have the third highest net spend in the Premier League over the past three seasons of £111 million (according to Transfer League), only behind Manchester City £241 million and Manchester United £199 million.

In that period, the club has brought in Mesut Ozil, Alexis Sanchez, Danny Welbeck, Calum Chambers, Gabriel and Mathieu Debuchy, though it is somewhat strange that they have only spent a net £13 million this season on Cech and Elneny.

Arsenal did report a small £3 million loss after tax for the latest interims, compared to a £6 million profit for the same period the previous season. They were actually boosted by a £3 million tax credit, due to the revaluation of deferred tax balances based on the UK’s lower future rates of corporation tax. Before tax, Arsenal suffered a £12 million deterioration, as a £6 million profit swung into a £6 million loss.


By far the biggest reason for this decline was profit on player sales, as the club made hardly any money from this activity, compared to £27 million last season, mainly due to the sales of Thomas Vermaelen to Barcelona and Carlos Vela to Real Sociedad.

As a counterpoint, Arsenal’s underlying profitability actually increased with EBITDA (Earnings Before Interest, Taxation, Depreciation and Amortisation) rising from £23 million to £35 million.

This was because revenue grew by £10 million (6%) from £148 million to £158 million, mainly due to broadcasting, up £7 million (14%) to £60 million, thanks to higher UEFA Champions League distributions. There was also growth in commercial income, up £3 million (5%) to £55 million, and player loans, £1 million higher at £1.5 million. On the other hand, match day revenue was £2 million (4%) lower at £41 million, due to fewer home matches being played.

Expenses (including wages) were £2 million lower, but player amortisation rose £4 million to £29 million.

"Hector was the first of the gang"

There was limited activity in the property business, with the only transaction of note being recognition of the final instalment of the sale of Queensland Road development, though revenue and profit were both £2 million higher.

The accounts also benefited from a £5 million reduction in net finance charges from £12 million to £7 million, thanks to the introduction of Financial Reporting Standard (FRS) 102. Although this had minimal impact on this year’s profit, it has meant a restatement of prior year comparatives.

In particular, the interest rate swap, used to fix the interest rate on the floating rate stadium bonds, has to be included on the balance sheet at fair value with any changes in value reported in the profit and loss of each period. As there was a significant increase in negative fair value last year, with the financial markets anticipating that UK interest rates would remain lower for longer than previously expected, this meant a higher charge.


Of course, Arsenal have been very much the poster child of the Premier League in terms of making money. In fact, you have to go back as far as 2002 to find the last time that they made a loss. They have made total combined profits before tax of £226 million in the eight years since 2008.

The question is whether this year’s loss at the interim stage will mark a change in this positive trend? It seems unlikely, given that Arsenal have been in a similar position twice recently, namely in 2011 and 2014, when they managed to convert a first half loss into a full year profit on both occasions.


Nevertheless, these accounts again show how much influence player sales (and property development) have had at Arsenal. Excluding these items, Arsenal have actually lost money in each of the last five seasons.

More encouragingly, Arsenal’s underlying profitability was actually better in these interims compared to last year, as they would have reported a smaller loss after excluding these once-off factors: £8 million in 2015/16 compared to £21 million in 2014/15.

Actually, stability in the playing squad with no major sales might be considered as “a positive factor for the club”, according to Sir Chips. The good news is that Arsenal no longer need to sell players from a financial perspective.


The only other English club that has published half-year accounts is Manchester United and it is interesting to compare the Red Devils with Arsenal, as this highlights one major difference between the two. United made a £33 million profit before tax, which was £39 million better than Arsenal’s £6 million loss, even though their costs were £48 million higher.

The main reason for United’s superiority is their commercial revenue of £137 million, which is an incredible £82 million more than Arsenal’s £55 million. Match day revenue is also £14 million higher, but that is misleading, as United have played six more home games in the period than Arsenal.


Nevertheless, Arsenal have the seventh highest revenue in the world, based on 2014/15 annual accounts, having overtaken Chelsea last season. This is obviously pretty impressive, but the harsh reality is that they are still a fair way behind the leading elite, e.g. at £331 million they are around £100 million lower than the two Spanish giants, Real Madrid £439 million and Barcelona £427 million.

If we compare Arsenal’s revenue with the other clubs in the Deloitte Money League top ten, it is immediately apparent where their biggest problem lies, namely commercial income. Arsenal’s £103 million might not seem so bad, but it is only higher than Juventus, and is lower than every other club at this level.


Granted, the £123 million shortfall against PSG (£103 million vs. £226 million) is largely due to the French club’s “friendly” agreement with the Qatar Tourist Authority, but there are still major gaps to the other clubs in commercial terms: Bayern Munich £108 million, Manchester United £97 million, Real Madrid £85 million, Barcelona £82 million and Manchester City £71 million.

On the plus side, Arsenal enjoy the highest match day income in the world, while they are also competitive on broadcasting revenue, only really losing out compared to the individual deals negotiated by Real Madrid and Barcelona.


Arsenal’s commercial revenue passed £100 million for the first time in 2014/15, as it shot up £26 million (34%) from £77 million to £103 million, largely due to the new PUMA kit deal, which started in July 2014.

Looking at previous years, we can see that usually the full year commercial revenue is more or less double the first half. On that basis, we could estimate Arsenal’s 2015/16 revenue as £110 million (i.e. twice £55 million).

Although the chairman described the interim increase of £2.8 million (5%) as “robust growth”, his comments last year seemed more appropriate: “Inevitably, this growth rate will now slow as we have our key partnerships with Emirates and PUMA in place for the medium term.”


Even though Arsenal had the highest percentage growth since 2012 of the leading six English clubs, the reality is that they are still a long way below the Manchester clubs: United’s 2014/15 revenue was up to £197 million (nearly twice as much), while City’s revenue was £173 million. That might be to be expected, but less understandable is that Arsenal are also behind Liverpool £116 million and Chelsea £108 million.

Despite an increase in the number of worldwide partnerships to 33, the concern is that Arsenal’s commercial performance will continue to place them at a competitive disadvantage relative to other leading clubs. Further substantial increases are only likely to come as a result of success on the pitch, which again makes you wonder why the available cash has not been spent on strengthening the squad.


Although match day income fell in the interims, this was because Arsenal played two less home games (9 compared to 11) this season, so it should be made up in the rest of the year. Match day revenue is always weighted towards the second half, so my expectation is that Arsenal will again top £100 million by the end of the season. The actual amount will depend on the number of home games, i.e. progress in the cup competitions.

Incidentally, Arsenal have confirmed that there will be no general increase in ticket prices next season.


Similarly, broadcasting income is always higher in the second half of the year, though the actual amount received will depend on Arsenal’s final Premier League position and how far they progress in the knockout competitions.


Each place in the Premier League is worth an additional £1.2 million, while the amount received also depends on the number of Arsenal games broadcast live, though the vast majority of the payment is based on an equal distribution among the 20 clubs: half the domestic payment, 100% of the overseas payment and commercial income.


However, Arsenal will earn more from the Champions League, as the prize money has increased in the first year of a new three-year UEFA revenue cycle, e.g. €12 million for group participation (compared to €8.6 million), €1.5 million for a group stage win (€1 million), €5.5 million for reaching the last 16 (€3.5 million).


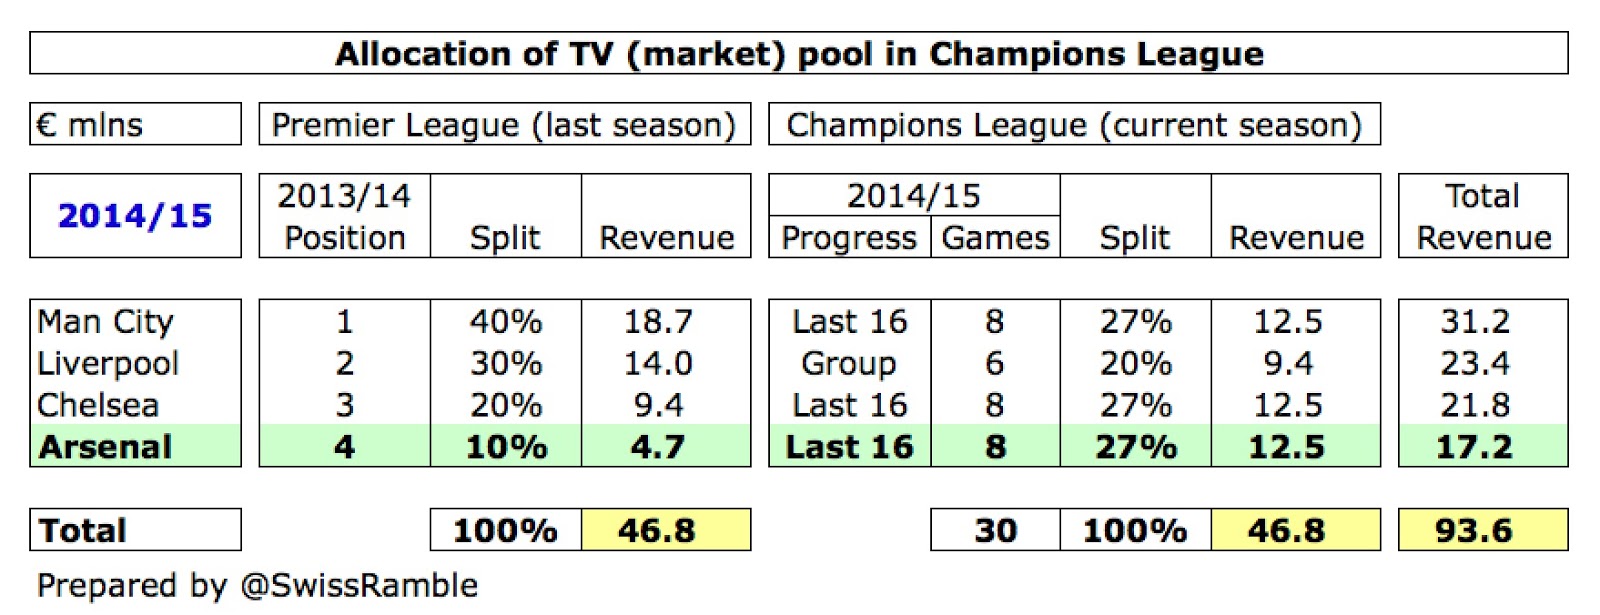
The market pool is also significantly higher, thanks to BT Sports paying more than Sky/ITV for live games. Arsenal’s 2015/16 payment will partly depend on how far they progress in this season’s Champions League, but also how well the other English clubs do, so if City and Chelsea get past the last 16, Arsenal will receive a smaller share for this element than 2014/15.

However, the other half of the market pool is based on where they finished in the previous season’s Premier League (3rd in 2014/15, compared to 4th the year before), which means that their share here will increase from 10% to 20%.

Unfortunately, Arsenal do not disclose their wage bill in the interim accounts, but they do include some comments that suggest that it was around the same level as the previous year. On the one hand, there was no Champions League qualification bonus in this year’s figures, as the 2014/15 accounts included the players’ bonus earned as a result of finishing in third place. On the other hand, the chairman stated, “This has been offset by increases in the underlying wage bill arising from certain contract extensions within the squad”, (e.g. Santi Cazorla and Theo Walcott).


What is interesting is how the wage bills at the top clubs have been converging around the £200 million level. Arsenal’s £192 million is still the 4th highest, but the gap has been closing. Chelsea once again have the highest wage bill in the top flight at £216 million, which is the first time since 2010, ahead of Manchester United £203 million and Manchester City £194 million.

Both Manchester clubs actually saw a reduction in wages in 2014/15. United’s decrease was due to their lack of success on the pitch, as bonuses fell, while City’s is partly due to a group restructure, where some staff are now paid by group companies, which then charge the club for services provided.

Continued investment in the playing squad has seen a further increase in player amortisation to £29 million, up £4 million (14%). On a full year basis, this has risen from just £22 million in 2011 to £54 million in 2015, and is likely to be higher still in 2016.


As a reminder, player amortisation is the way in which player purchases are reflected in the profit and loss account. To illustrate how this works, if Arsenal paid £25 million for a new player with a five-year contract, the annual expense would only be £5 million (£25 million divided by 5 years) in player amortisation (on top of wages).

As might be expected, those clubs who have traditionally spent big in the transfer market have the highest player amortisation: Manchester United £100 million, Manchester City £70 million and Chelsea £69 million.

There is no mention of whether the interims include another payment to the company of majority owner Stan Kroenke. This has amounted to £3 million in each of the last two years for a “wide range of services”, albeit with precious little transparency about exactly what these services comprised.


Gross debt has reduced by £2 million from £234 million to £232 million with net debt virtually unchanged at £72 million, due to a similar decrease in cash from £161 million to £159 million.

Arsenal’s debt comprises long-term bonds that represent the “mortgage” on the stadium (£194 million), debentures held by supporters (£14 million) and derivative financial instruments (£24 million). The club has no short-term debt to worry about.

Prior year debt figures have also been restated following the implementation of FRS 102, so the debt as at 31 May increased from £234 million to £239 million.


Although Arsenal’s debt has come down significantly from the £411 million peak in 2008, it is still a heavy burden, requiring an annual payment of around £19 million, covering interest and repayment of the principal. The interest payable of £13 million is a lot more than any other Premier League club (£5-6 million at Manchester City, Everton, West Ham and Liverpool) with the exception of Manchester United, who leapt to £35 million in 2014/15.

Although the net debt stands at only £72 million, thanks to those large cash balances, the gross debt of £232 million remains the second highest in the Premier League, only behind Manchester United, who still have £444 million of debt even after all the Glazers’ various re-financings.


Overall, it feels a little like Groundhog Day at Arsenal. To paraphrase the late, very great David Bowie, “The film is a saddening bore, for we’ve lived it ten times or more.”

While Arsenal might not be at the very pinnacle of football clubs financially, they are still better placed than most, so it is difficult to understand why the club has not used all of its resources to give itself the best chance of success. Very few fans want the club to throw caution to the winds, but they could surely invest more than they have done.

By most standards, Arsenal have a fine squad that is certainly capable of challenging for major honours, but in recent years there has always been something lacking. The latest financial figures continue to demonstrate that there is enough money to be competitive in the market.

Who knows whether a couple of world class recruits would make the difference and take the club to the next level, but surely it would be better for the club to spend what it can, so that its wealth can be seen on the pitch rather than gather dust in the accounts. 
Share:

Tuesday, February 23, 2016

Lazarus Rising or Icarus Falling? The GoPro and LinkedIn Question!

As I watch GoPro and LinkedIn, two high flying stocks of not that long ago, come back to earth my mind is drawn to two much told stories. The first is the Greek myth about Icarus, a man who had wings of feathers and wax, but then soared so high that the sun melted his wings and he fell to earth. The other is that of Lazarus, who in the biblical story, is raised from the dead, four days after his burial. As investors, the decision that we face with GoPro and LinkedIn is whether like Icarus, they soared too high and have been scorched (perhaps permanently) or like Lazarus, they will come back to life.

GoPro: Camera, Smart Phone Accessory or Social Media Company?
GoPro went public in June 2014 at $24/share and quickly climbed in the months following to hit $93.85 in October of that year. When I first valued the company in this post, the stock was still trading at more than $70/share. Led by Nick Woodman, a CEO who had a knack for keeping himself in the public eye (not necessarily a bad thing for publicity seeking start up), and selling an action camera that was taking the world by storm, the company’s spanning of the camera, smartphone accessory and social media businesses seemed to position it to conquer the world. Even at its peak, though, it was clear the competitive storm clouds were gathering as other players in the market, noting GoPro’s success, readied their own products.

In the last year, GoPro lost much of its luster as its product offerings have aged and sales growth has lagged expectations. It is a testimonial to these lowered expectations that investors were expecting revenues to drop, relative to the same quarter in the prior year, in the most recent quarterly earnings report from the company.

The company reported that it not only grew slower and shipped fewer units than expected in the most recent quarter, but also suggested that future revenues would be lower than expected. While the company’s defense was that consumers were waiting for the new GoPro 5, expected in 2016, investors were not assuaged. The stock dropped almost 20% on the news, hitting an all-time low of $9.78, right after the announcement.

To evaluate how the disappointments of the last year have impacted value, I went back to October 2014, when I valued the stock at $30.57. Viewing it as part camera, part smart phone and part social media company (whose primary market is composed of hyper active, over sharers), I estimated that it would be able to grow its revenues 36% a year, to reach about $10 billion in steady state, while earning a pre-tax operating margin of 12.5%. Revisiting that story, with the results in the earnings reports since, it looks like competition has arrived sooner and stronger than anticipated, and that the company’s revenue growth and operating margins will both be more muted.

In my updated valuation, I reduced my targeted revenues to $4.7 billion in steady state, my target operating margin to 9.84% (the average for electronics companies) and increased the likelihood that the company will fail to 20%. The value per share that I get with my updated estimates is $17.66, 35% higher than the price per share of $12.81, at the start of trading on February 22, 2016.  Looking at the simulation of values, here is what I get:
Spreadsheet with valuation
At its price of $12.81, there is a 68% chance that the stock is under valued, at least based on my assumptions.

I am fully aware of the risks embedded in this valuation. The first is that as an electronics hardware company that derives the bulk of its sales from one item, GoPro is exposed to a new product that is viewed as better by consumers, and especially so if that new product comes from a company with deep pockets and a big marketing budget; a Sony, Apple or Google would all fit the bill. The second is that the management of GoPro has been pushing a narrative that is unfocused and inconsistent, a potentially fatal error for a young company. I think that the company not only has to decide whether its future lies in action cameras or in social media and act accordingly, but it also has to stop sending mixed messages on growth; the stock buyback last year was clearly not what you would expect from a company with growth options.

Linkedin: The Online Networking Alternative?
LinkedIn went public in May 2011, about a year ahead of Facebook and can thus be viewed as one of the more seasoned social media companies in the market. Like GoPro, its stock price soared after the initial public offering:

LinkedIn Stock Price: IPO to Current
While it often lumped up with other social media companies, Linkedin is different at two levels. The first is that it is less dependent on advertising revenues than other social media companies, deriving almost 80% of its revenues from premium subscriptions that it sells its customers and from matching people up to jobs. The second is that its pathway to profitability has been both less steep and speedier than the other social media companies, with the company reporting profits (GAAP) in both 2013 and 2014, though they did lose money in 2015.

Unlike GoPro, where expectations and stock prices had been on their way down in the year before the most recent earnings report, the most recent earnings report was a surprise, though, at least at first sight, it did not include information that would have led to this abrupt a reassessment:
Linkedin delivered earnings and revenue numbers that were higher then expectations and much of the negative reaction seems to have been to the guidance in the report.

While I have not valued Linkedin explicitly on this blog for the last few years, it has been a company that has impressed me for a simple reason. Unlike many other social media companies that seemed to be focused on just collecting users, Linkedin has always seemed more aware of the need to work on two channels, delivering more users to keep markets happy and working, at the same time, on monetizing these users in the other, for the eventuality that markets will start wanting more at some point in time. Its presence in the manpower market also means that it does not have to become one more player in the crowded online advertising market, where the two biggest players (Facebook and Google) are threatening to run up their scores. Nothing in the latest earnings report would lead me to reassess this story, with the only caveat being that the drop in earnings in the most recent year suggests that profit margins in the manpower business are likely to be smaller and more volatile than in the advertising business.

Allowing for Linkedin’s presence in two markets, I revalued the company with revenue growth of 25% a year for the next five years, leading to $15.3 billion in revenues in steady state (ten years from now), and a target pre-tax operating margin of 18%, lower than my target margins for Twitter or Facebook, reflecting the lower margins in the manpower business. The value per share that I get for the company is $103.49, about 10% below where the market is pricing the stock right now. The results of the simulation are presented below:

Spreadsheet with valuation
At its current stock price, there is about a 40% chance that the company is under valued.  If you have wanted to hold LinkedIn stock, and have been put off by the pricing, the price is tantalizingly close to making it happen. As with other social media companies, LinkedIn’s user base of 410 million and their activity on the platform are the drivers of its revenues and value.

The Acquisition Option
If you are already invested in GoPro or LinkedIn, one reason that you may have is that there will be someone out there, with deep pockets, who will acquire the firm, if the price stays where it is or drops further, thus putting a floor on the value. That is not an unreasonable assumption but to me, this has always been fool's gold, where the hope of an acquisition sustains value and the price goes up and down with each rumor. I have seen it play out on my Twitter investment and I do think it gets in the way of thinking seriously about whether your investment is backed by value.

That said, I do think that having an asset or assets that could be more valuable to another company or entity does increase the value of a company. It is akin to a floor, but it is a shifting floor, and here is why. Consider LinkedIn, a company with 410 million users. Even with the drop in market prices of social media companies in the last few months, the market is paying roughly $80/user (down from about $100/user a couple of years ago). You could argue that an acquirer would be a bargain, if they could acquire LinkedIn at $8 billion, roughly $20 a user. However, the price that an acquirer will be willing to pay for LinkedIn users will increase if revenues are growing at a healthy rate and the company is monetizing its users. 

To evaluate the impact that introducing the possibility of an acquisition does to LinkedIn's value, I started by assuming that the acquisition price for LinkedIn would be $8 billion, but that the value would range from $4 billion (if revenue growth is flat and margins are low) to $12 billion (if revenue growth is robust). I then reran the simulation of LinkedIn's valuation, with the assumption that the company would be bought out, if the market capitalization dropped below the acquisition price. In the picture below, I compare the values across the two simulations, one without an acquisition floor and one with:

You may be surprised by how small the effect of introducing an acquisition floor has on value but it reflects two realities. One is my assumption that the expected acquisition price is $8 billion; raising that number towards the current market capitalization of $15.4 billion will increase the effect. The other is my assumption that the acquisition price will slide lower, if LinkedIn's revenue growth and operating profitability lag. 

Fighting my Preconceptions
I must start with a confession. After watching the price drop on these two stocks, and prior to my valuations, I really, really wanted LinkedIn to be my investment choice. I like the company for many reasons:
  1. As noted earlier, unlike many other social media companies, it is not just an online advertising company.
  2. The other business (networking and manpower) that the company operates in is appealing both because of its size, and the nature of the competition.
  3. The top management of LinkedIn has struck me as more competent and less publicity-conscious that those at some other high profile social media companies. I think it is good news that I had to think a few minutes about who LinkedIn's CEO was (Jeff Weiner) and check my answer.
I have a sneaking suspicion that my biases did affect my inputs for both companies, making me more pessimistic in my GoPro inputs and more optimistic on my LinkedIn values. That said, the values that I obtained were not in keeping with my preconceptions. In spite of my inputs, GoPro is significantly under valued and in spite of my implicit attempts to pump it up, LinkedIn does not make my value cut. Put differently, the market reaction to the most recent earnings report at LinkedIn was clearly an over reaction, but it just moved the stock from extremely over valued, on my scale, to close to fair value. 

YouTube Video

Datasets
  1. GoPro - Bloomberg Summary (including 2015 numbers)
  2. LinkedIn - Bloomberg Summary (including 2015 numbers)
Spreadsheets
  1. GoPro - Valuation in February 2016
  2. Twitter - Valuation in February 2016
Blog posts in this series
  1. A Violent Earnings Season: The Pricing and Value Games
  2. Race to the top: The Duel between Alphabet and Apple!
  3. The Disruptive Duo: Amazon and Netflix 
  4. Management Matters: Facebook and Twitter
  5. Lazarus Rising or Icarus Falling? The GoPro and LinkedIn Question!
  6. Investor or Trader? Finding your place in the Value/Price Game! (Later this year)
  7. The Perfect Investor Base? Corporation and the Value/Price Game (Later this year)
  8. Taming the Market? Rules, Regulations and Restrictions (Later this year)

Share:

Friday, February 19, 2016

Management Matters: Facebook and Twitter!

I am not a big user of social media. I have a Facebook page, which I don’t visit often, never respond to pokes and don’t post on at all. I tweet, but my 820 lifetime tweets pale in comparison to prolific tweeters, who tweet that many times during a month. That said, I have been fascinated with, and have followed, both companies from just prior to their public offerings and not only have learned about the social media business but even more about my limitations in assessing their values. The paths that these companies have taken since their public offerings also offer illustrative examples of how markets assess and miss-assess these companies, why management matters, and the roller coaster ride that investors have to be willing to take, when they make bets on these companies.

Facebook

In its brief life as a public company, Facebook has acquired a reputation of being a company that not only manages to make money while it grows but is also able to be visionary and pragmatic, at the same time. In its most recent earnings report on January 27, 2016, Facebook delivered its by-now familiar combination of high revenue growth, sky high margins and seeming endless capacity to add to its user base and more importantly, monetize those users:


The market’s reaction to this mostly positive report was positive, with the stock rising 14% in the after market.

I first valued Facebook a few weeks ahead of its IPO and again at the time of its IPO at about $27/share, laughably low, given that the stock is close to $100 today, but reflecting the concerns that I had on four fronts: whether it could keep user growth going, given that it was already at a billion users then, whether it could make the shift to mobile, as users shifted from computers to mobile phones and tablets, whether it could scale up its online advertising revenues and whether it could continue to earn its high margins in a business fraught with competition. The company, through the first four years of its existence has emphatically answered these questions. It has managed to increase its user base from huge to gargantuan, it has made a successful transition to mobile, perhaps even better than Google has, and it has been able to keep its unusual combination of revenue growth and sky-high margins. Prior to the prior year's last earnings report, in November 2015, I was already seeing Facebook as potentially the winner in the online advertising battle with Google and capable of not only commanding a hundred billion in revenues in ten years but with even higher margins than Google. The value per share of almost $80/share, that I estimated for the company in November 2015, reflects the steady rise that I have reported in my intrinsic value estimates for the company over the last five years. If anything, the story is reinforced after the earnings report, with revenue growth coming in at about 44% and an operating margin of 51.36%.

The value per share that I get for the company, with this narrative, is about $95/share, just a little bit under the $102/share that the stock was trading at in February 2016.  As with my other valuations in this series, I ran a simulation of Facebook’s value and the results are below:
At the prevailing price of $102/share, the stock was close to fairly priced on February 12, at least based on my inputs. 

I am sure that there will be others who will put Facebook under a microscope to find its formula for success, but there are two actions that are illustrative of the company’s mindset. The first was its aforementioned conquest of the mobile market, where it badly lagged its competitors at the time of it IPO. Rather than find excuses for its poor performance, the company went back to the drawing board and created a mobile version which not only improved user experience but provided a platform for ad revenues. The second was the company’s acquisition of Whatsapp, an acquisition that cost the company more than $20 billion and provoked a great deal of head scratching among value minded people at time, since Whatsapp had little in revenues and no earnings at the time. I argued at the time that the acquisition made sense from a pricing perspective, since Facebook was buying 450 million Whatsapp users for about $40/user, when the market was pricing these users at $100/user. That acquisition may have been driven by pricing motivations but it has yielded a value windfall for the company, especially in Asia and Latin America, with more than 100 million Whatsapp users just in India. 

It is true that Facebook’s latest venture in India, Free Basics, where it had partnered with an Indian telecom firm to offer free but restricted internet service, has been blocked by the Indian government, but it is more akin to a bump in the road than a major car wreck. At the risk of rushing in where others have been burned for their comments, I am cynical enough to see both sides of the action. Much as Facebook would like to claim altruistic motives for the proposal, the restriction that the free internet use would allow you access only to the portion of the online space controlled by Facebook makes me think otherwise. As for those who opposed Free Basics, likening Facebook’s plans to colonial expansion is an over reach. In my view, the problem with the Indian government for most of the last few decades is not that it's actions are driven by knee jerk anti-colonialism, but that it behaves like a paternalistic, absentee father, insisting to its people that it will take care of necessities (roads, sewers, water, power and now, broadband), while being missing, when action is needed.

On a personal note, I was lucky to be able to buy Facebook a few months after it went public at $18, but before you ascribe market timing genius to me, I sold the stock at $45. At the time, Tom Gardner, co-founder of Motley Fool and a person that I have much respect for, commented on my valuation  (on this blog) and suggested that I was under estimating both Facebook's potential and its management. He was right, I was wrong, but I have no regrets!

Twitter
If Facebook is evidence that you can convert a large social media base into a business platform to deliver advertising and more, Twitter is the cautionary note on the difficulties of doing so. Its most recent earnings report on February 10, 2016, continued a recent string of disappointing news stories about the company:


The market reacted badly to the stagnant user base (though 320 million users is still a large number) and Twitter’s stock price hit an all time low at $14.31, right after the report. The positive earnings may impress you, but remember that this is the reengineered and adjusted version of earnings, where stock based compensation is added back and other sleights of hand are performed to make negative numbers into positive ones.

As with Facebook, I first valued Twitter in October 2013, just before its IPO and arrived at an estimate of value of 17.36 per share. My initial narrative for the company was that it would be successful in attracting online advertising, but that its format (the 140 character limit and punchy messages) would restrict it to being a secondary medium for advertisers (thus limiting its eventual market share).The stock was priced at $26, opened at $45 and zoomed to $70, largely on expectations that it would quickly turn its potential (user base) into revenues and profits. However, in the three years since Twitter went public, it is disappointing how little that narrative has changed. In fact, after the most recent earnings report, my narrative for Twitter remains almost unchanged from my initial one, and is more negative than it was in the middle of last year.


Since the narrative has not changed since the original IPO, the value per share for Twitter, not surprisingly, remains at about $18. The results of my simulation are below:

My estimate of value today is lower than my valuation in August of last year, when I assumed that the arrival of Jack Dorsey at the helm of the company, would trigger changes that would lead to monetization of its user base.

So what’s gone wrong at Twitter? Some of the problems lie in its structure and it is more difficult to both attract advertising and present that advertising in a non-intrusive way to users in a Tweet stream. (I will make a confession. Not only do I find the sponsored tweets in my feed to be irritating, but I have never ever felt the urge to click on one of them.) Some of the problems though have to be traced back to the way the company has been managed and the choices it has made since going public. In my view, Twitter has been far too focused on keeping Wall Street analysts happy and too little on building a business. Initially, that strategy paid off in rising stock prices, as analysts told the company that the game was all about delivering more users and the company delivered accordingly. The problem, though, is that users, by themselves, were never going to be a sufficient metric of business success and that the market (not the analysts) transitioned, in what I termed a Bar Mitzvah moment, to wanting to see more substance, and the company was not ready. 

Can the problems be fixed? Perhaps, but time is running out. With young companies, the perception of being in trouble can very easily lead to a death spiral, where employees and customers start abandoning you for greener pastures. This is especially true in the online advertising space, where Facebook and Google are hungry predators, consuming every advertising dollar in their path. I have said before that I don’t see how Jack Dorsey can do what needs to be done at Twitter, while running two companies, but I am now getting to a point where I am not sure that Jack Dorsey is the answer at Twitter.  As someone who bought Twitter at $25 late last year, I am looking for reasons to hold on to the stock. One, of course, is that the company may be cheap enough now that it could be an attractive acquisition target, but experience has also taught when the only reason you have left for holding on to a stock is the hope that someone will buy the company, you are reaching the bottom of the intrinsic value barrel. The best that I can say about Twitter, at the moment, is that at $18/share, it is fairly valued, but if the company continues to be run the way it has for the last few years, both price and value could move in tandem to zero. Much as I would like to hold on until the stock gets back to $25, I am inclined to sell the stock sooner, unless the narrative changes dramatically.

The Postscript
Valuing Facebook and Twitter after valuing Alphabet is an interesting exercise, since all three companies are players in the online advertising space. At their current market capitalization, the market is pricing Facebook and Google to not just be the winners in the game, but pricing them to be dominant winners. In fact, the revenues that you would need in ten years to justify their pricing today is close to $300 billion, which if it comes entirely from online advertising, would represent about 75% of that market. If you are okay with that pricing, then it is bad news for the smaller players in online advertising, like Twitter, Yelp and Snapchat, who will be fighting for crumbs from the online advertising table. This is a point that I made in my post on big market delusions last year, but it leads to an interesting follow up. If you are an investor, I can see a rationale for holding either Google or Facebook in your portfolio, since there are credible narratives for both companies that result in them being under valued. I think you will have a tougher time justifying holding both, unless your narrative is that the winner-take-most nature of the game will lead to these companies dominating  the online advertising market and leaving each other alone. If  Google, Facebook and the smaller players (Twitter, Yelp, a private investment in Snapchat) are all in your portfolio, I am afraid that I cannot see any valuation narrative that could justify holding all of these companies at the same time.

Closing on a personal note, I have discovered, during the course of valuation, that I learn as much about myself as I do about the companies that I value. In the case of Facebook and Twitter, I have learned that I hold on to my expectations too long, even in the face of evidence to the contrary, and that I under estimate the effect of management, especially at young companies to deliver surprises (both positive and negative). I sold Facebook too soon in 2013, because my valuations did not catch up with the company’s changed narrative until later and perhaps bought Twitter too early,  last year, because I thought that the company’s user base was too valuable for any management to fritter away. I live and I learn, and I am sure that I will get lots of chances to revisit these companies and make more mistakes in the future.

YouTube Video


Datasets
  1. Facebook 10K (2015)
  2. Twitter - Bloomberg Summary (including 2015 numbers)
Spreadsheets
  1. Facebook - Valuation in February 2016
  2. Twitter - Valuation in February 2016
Blog posts in this series
  1. A Violent Earnings Season: The Pricing and Value Games
  2. Race to the top: The Duel between Alphabet and Apple!
  3. The Disruptive Duo: Amazon and Netflix 
  4. Management Matters: Facebook and Twitter
  5. Lazarus Rising or Icarus Falling? The GoPro and LinkedIn Question!
  6. Investor or Trader? Finding your place in the Value/Price Game! (Later this year)
  7. The Perfect Investor Base? Corporation and the Value/Price Game (Later this year)
  8. Taming the Market? Rules, Regulations and Restrictions (Later this year)
    Share:

    Labels

    Blog Archive

    Recent Posts

    Unordered List

    Theme Support