• This is default featured slide 1 title

    Go to Blogger edit html and find these sentences.Now replace these sentences with your own descriptions.This theme is Bloggerized by Lasantha Bandara - Premiumbloggertemplates.com.

  • This is default featured slide 2 title

    Go to Blogger edit html and find these sentences.Now replace these sentences with your own descriptions.This theme is Bloggerized by Lasantha Bandara - Premiumbloggertemplates.com.

  • This is default featured slide 3 title

    Go to Blogger edit html and find these sentences.Now replace these sentences with your own descriptions.This theme is Bloggerized by Lasantha Bandara - Premiumbloggertemplates.com.

  • This is default featured slide 4 title

    Go to Blogger edit html and find these sentences.Now replace these sentences with your own descriptions.This theme is Bloggerized by Lasantha Bandara - Premiumbloggertemplates.com.

  • This is default featured slide 5 title

    Go to Blogger edit html and find these sentences.Now replace these sentences with your own descriptions.This theme is Bloggerized by Lasantha Bandara - Premiumbloggertemplates.com.

Showing posts with label Apple. Show all posts

Monday, December 3, 2018

Investing Whiplash: Looking for Closure with Apple and Amazon!

In September, I took a look, in a series of posts, at two companies that had crested the trillion dollar market cap mark, Apple and Amazon, and concluded that series with a post where I argued that both companies were over valued. I also mentioned that I was selling short on both stocks, Amazon for the first time in 22 years of tracking the company, and Apple at a limit price of $230. Two months later, both stocks have taken serious hits in the market, down almost 25% apiece, and one of my short sales has been covered and the other is still looking profitable. It is always nice to have happy endings to my investment stories, but rather than use this as vindication of my valuation or timing skills, I will argue that I just got lucky in terms of timing. That said, given how much these stocks have dropped over the last two months, it is an opportunity to not just revisit my valuations and investment judgments, but also to draw some general lessons about intrinsic valuation and pricing.

My September Valuations: A Look Back
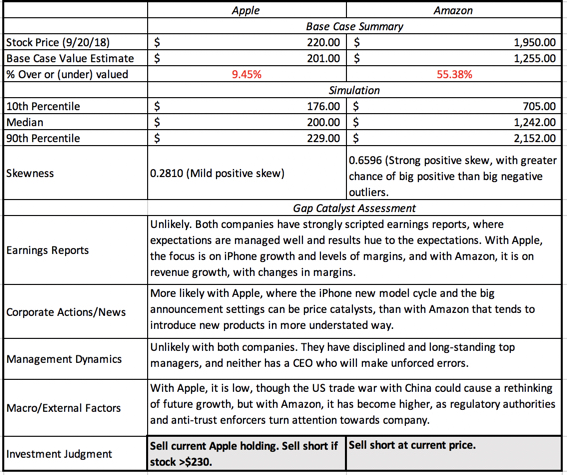
In September, I valued Apple and Amazon and arrived at a value per share of roughly $200 for Apple and $1255 for Amazon, well below their prevailing stock prices of $220 (Apple) and $1950 (Amazon). I was also open about the fact that my valuations reflected my stories for the companies, and that my assumptions were open for debate. In fact, I estimated value distributions for both companies and noted that not only did I face more uncertainty in my Amazon valuation, but also that there was a significant probability in both companies that my assessment (that the stocks were over valued) was wrong. I summarized my results in a table that I reproduce below:
Apple Valuation & Amazon Valuation in September 2018
I did follow through on my judgments, albeit with some trepidation, selling short on Amazon at the prevailing market price (about $1950) and putting in a limit short sell at $230, which was fulfilled on October 3, as the stock opened above $230. With both stocks, I also put in open orders to cover my short sales at the 60th percentile of my value distributions, i.e., $205 at Apple and $1412 at Amazon, not expecting either to happen in the near term. (Why 60%? Read on...) Over the years, I have learned that investment stories and theses, no matter how well thought out and reasoned, don't always have happy endings, but this one did, and at a speed which I did not expect:
My Apple short sale which was initiated on October 3 was closed out on November 5 at $205, while Amazon got tantalizingly close to my trigger price for covering of $1412 (with a low of $1420 on November 20), before rebounding. 

Intrinsic Value Lessons
Every investment, whether it is a winner or a loser, carries investment lessons, and here are mine from my AAPL/AMZN experiences, at least so far:
  1. Auto pilot rules to fight behavioral minefields: If you are wondering why I put in limit orders on both my Apple short sale and my covering trades on both stocks, it is because I know my weaknesses and left to my own biases, the havoc that they can wreak on my investment actions. I have never hidden the fact that I love Apple as a company and I was worried that if I did not put in my limit short sell order at $230, and the stock rose to that level, I would find a way to justify not doing it. For the limit buys to cover my short sales, I used the 60th percentile of the value distribution, because my trigger for buying a stock is that it be at least at the 40th percentile of its value distribution and to be consistent, my trigger for selling is set at the 60th percentile. It is my version of margin of safety, with the caveat being that for stocks like Amazon, where uncertainty abounds, this rule can translate into a much bigger percentage price difference than for a stock like Apple, where there is less uncertainty. (The price difference between the 60th and 90th percentile for Apple was just over 10%, whereas the price difference between those same percentiles was 35% for Amazon, in September 2018.)
  2. Intrinsic value changes over time: Among some value investors, there is a misplaced belief that intrinsic value is a timeless constant, and that it is the market that is subject to wild swings, driven by changes in mood and momentum. That is not true, since not only do the determinants of value (cash flows, growth and risk) change over time, but so does the price of risk (default spreads, equity risk premiums) in the market. The former occurs every time a company has a financial disclosure, which is one reason that I revalue companies just after earnings reports, or a major news story (acquisition, divestiture, new CEO),  and the latter is driven by macro forces. That sounds abstract, but I can use Apple and Amazon to illustrate my point. Since my September valuations for both companies occurred after their most recent earnings reports, there have been no new financial disclosures from either company. There have been a few news stories and we can argue about their consequentiality for future cash flows and growth, but the big change has been in the market. Since September 21, the date of my valuation, equity markets have been in turmoil, with the S&P 500 dropping about 5.5% (through November 30) and the US 10-year treasury bond rate have dropped slightly from 3.07%  to 3.01%, over the same period. If you are wondering why this should affect terminal value, it is worth remembering that the price of risk (risk premium) is set by the market, and the mechanism it has for adjusting this price is the level of stock prices, with a higher equity risk premium leading to lower stock prices. In my post at the end of a turbulent October, I traced the change in equity risk premiums, by day, through October and noted that equity risk premiums at the end of the month were up about 0.38% from the start of the month and almost 0.72% higher than they were at the start of September 2018. In contrast, November saw less change in the ERP, with the ERP adjusting to 5.68% at the end of the month.
    Plugging in the higher equity risk premium and the slightly lower risk free rate into my Apple valuation, leaving the rest of my inputs unchanged, yields a value of $197 for the company, about 1.5% less than my $200 estimate on September 21. With Amazon, the effect is slightly larger, with the value per share dropping from $1255 per share to $1212, about 3.5%. Those changes may seem trivial but if the market correction had been larger and the treasury rate had changed more, the value effect would have been larger.
  3. But price changes even more: If the fact that value changes over time, even in the absence of company-specific information, makes you uncomfortable, keep in mind that the market price usually changes even more. In the case of Apple and Amazon, this is illustrated in the graph below, where I compare value to price on September 21 and November 30 for both companies:
    In just over two months, Apple's value has declined from $201 to $196, but the stock price has dropped from $220 to $179, shifting it from being overvalued by 9.54% to undervalued by 9.14%. Amazon has become less over valued over time, with the percentage over valuation dropping from  55.38% to 39.44%. I have watched Apple's value dance with its price for  much of this decade and the graph below provides the highlights:
    From my perspective, the story for Apple has remained largely the same for the last eight years, a slow-growth, cash machine that gets the bulk of its profits from one product: the iPhone. However, at regular intervals, usually around a new iPhone model, the market becomes either giddily optimistic about it becoming a growth company (and pushes up the price) or overly pessimistic about the end of the iPhone cash franchise (and pushes the price down too much). In the face of this market  bipolarity, this is my fourth round of holding Apple in the last seven years, and I have a feeling that it will not be the last one.
  4. Act with no regrets:  I did cover my short sale, by buying back Apple at $205, but the stock continued to slide, dropping below $175 early last week. I almost covered my Amazon position at $1412, but since the price dropped only as low as $1420, my limit buy was not triggered, and the stock price is back up to almost $1700. Am I regretful that I closed too early with Apple and did not close out early enough with Amazon? I am not, because if there is one thing I have learned in my years as an investor, it is that you have stay true to your investment philosophy, even if it means that you leave profits on the table sometimes, and lose money at other times. I have faith in value, and that faith requires me to act consistently. I will continue to value Amazon at regular intervals, and it is entirely possible that I missed my moment to sell, but if so, it is a price that I am willing to pay.
  5. And flexible time horizons: A contrast that is often drawn between investors and traders is that to be an investor, you need to have a long time horizon, whereas traders operate with windows measured in months, weeks, days or even hours. In fact, one widely quoted precept in value investing is that you should buy good companies and hold them forever. Buy and hold is not a bad strategy, since it minimizes transactions costs, taxes and impulsive actions, but I hope that my Apple analysis leads you to at least question its wisdom. My short sale on Apple was predicated on value, but it lasted only a month and four days, before being unwound. In fact, early last week, I bought Apple at $175, because I believe that it under valued today, giving me a serious case of investing whiplash. I am willing to wait a long time for Apple's price to adjust to value, but I am not required to do so. If the price adjusts quickly to value and then moves upwards, I have to be willing to sell, even if that is only a few weeks from today. In my version of value investing, investors have to be ready to hold for long periods, but also be willing to close out positions sooner, either because their theses have been vindicated (by the market price moving towards value) or because their theses have broken down (in which case they need to revisit their valuations).
Bottom Line
As investors, we are often quick to claim credit for our successes and equally quick to blame others for our failures, and I am no exception. While I am sorely tempted to view what has happened at Apple and Amazon as vindication of my value judgments, I know better. I got lucky in terms of timing, catching a market correction and one targeted at tech stocks, and I am inclined to believe that  is the main reason why my Apple and Amazon positions have made me money in the last two months. With Amazon, in particular, there is little that has happened in the last two months that would represent the catalysts that I saw in my initial analysis, since it was government actions and regulatory pushback that I saw as the likely triggers for a correction. With Apple, I do have a longer history and a better basis for believing that this is market bipolarity at play, with the stock price over shooting its value, after good news, and over correcting after bad news, but nothing that has happened  to the company in the last two month would explain the correction. Needless to say, I will bank my profits, even if they are entirely fortuitous, but I will not delude myself into chalking this up to my investing skills. It is better to be lucky than good!

YouTube Video


Blog Posts
  1. Apple and Amazon at a Trillion $: A Follow-up on Uncertainty and Catalysts (September 2018)
  2. An October Surprise: Making Sense of Market Mayhem (October 2018)


Share:

Friday, September 21, 2018

Amazon and Apple at a Trillion $: A Follow-up on Uncertainty and Catalysts!

In my last post, I looked at Apple and Amazon, as their market caps exceeded a trillion dollars, tracing the journey that they took over the last two decades to get to that threshold and valuing them  given their current standing. While you can check out the stories that I told and the details of my valuation in that post, I valued Apple at $200, about 9% less than the market price, and Amazon at abut $1255, about 35% lower than its market price. I concluded the post with a teaser, promising to come back with my decisions on whether I would sell my existing Apple shareholding and/or sell short on Amazon, after reviewing two loose ends. The first is to lay bare the uncertainties inherent in both valuations, to see if there is something in those uncertainties that I can use to make a better decision. The second is to evaluate whether there are catalysts that will convert the gap that I see between value and price into actual profits.

Facing up to Uncertainty
One of the recurrent themes in this blog is that we (as human beings) are not good at dealing with uncertainty. We avoid, evade and deny its existence, and in the process end up making unhealthy choices. When valuing companies, uncertainty is a given, a feature and not a bug, and traditional valuation models often give it short shrift. In fact, looking at my valuations of Apple and Amazon, you can see that the only place that I explicitly deal with uncertainty is in the discount rate, and even that process is rendered opaque, because I use betas and equity risk premiums to get to my final numbers. My cash flows reflect my expectations, and even in my moments of greatest hubris, I don't believe that I know, with precision, what will happen to Apple's revenue growth over time or how Amazon's operating margin will evolve in the future. So, why bother? In investing, you have no choice but to make your best estimates and value companies, knowing fully well that you will be wrong, no matter how much information you have and how good your models are. 

That said, it is puzzling that we still stick with point estimates (single numbers for revenue growth and operating margins) in conventional valuation, when we have the tools to bring in uncertainty  into our valuation judgments. While our statistics classes in college are a distant (and often painful) memory for most of us, there are statistical tools that can help us. While these tools may have been impractical even a decade ago, they are now more accessible, and when coupled with the richer data that we now have, we have the pieces in place to go beyond single value judgments. It is with this objective in mind that I recently updated a paper that I have on using probabilistic and statistical techniques to enrich valuation online, and you can get the paper by going to this link. Consider it a companion to another paper that I wrote a while back, dealing more expansively with uncertainty and healthy ways of dealing with it in investing and valuation.

Summarizing the probabilistic techniques that may help in valuation, I suggest three: (1) Scenario Analysis, for valuing companies that may have different valuations depending upon specific and usually discrete scenarios unfolding (for example a change in regulatory regimes for a bank or telecommunications company), (2) Decision Trees, for valuing companies that face sequential risk, i.e., you have to get through one phase of risk to arrive at the next one, as is the case with young drug companies that have new drugs in the regulatory pipeline and (3) Monte Carlo Simulations, the most general technique that can accommodate continuous and even correlated risks that you face in valuation, as is the case when you forecast revenue growth and operating margins for Apple and Amazon, in pursuit of their values.

Simulated Values: Apple and Amazon
Before delving into the simulations for Apple and Amazon, it is important that we set up the structure of the simulations first by first deciding what variables to build distributions around. While you may be tempted by the power of the tool to make every input (from risk free rates to terminal growth rates) into a distribution, my suggestion is that you focus on the variables that not only matter the most, but where you feel most uncertain. With Apple, the three inputs that I will build distributions around are revenue growth, operating margins and cost of capital. With Amazon, I will add a fourth variable to the mix, in the sales to invested capital, measuring how efficiently Amazon can deliver its revenue growth.

Apple: A September 2018 Simulation
I build around my core story for Apple, which is that it will be a slow growth, cash machine, deriving the bulk of its revenues, profits and value from the iPhone, but allow for uncertainty in each of my key inputs:
  1. Revenue growth: While my expected growth rate stays 3%, I allow for a range of growth rates from no growth (flat revenues) , if the iPhone's higher prices cost it signifiant market share) to 6% growth, which would require that Apple find a new growth source, perhaps from services or a new product.
  2. Operating Margin: In my story, I assumed that operating margin would decline to 25% (from  the current 30%) over the next five years. While I still feel that this is the best estimate, I allow for the possibility that competition will be stronger than expected (with margins dropping to 20%), at one end, and that Apple will be able to use its brand name to keep margins at 30%, at the other. 
  3. Cost of capital: My base case cost of capital is 8.20%, reflecting Apple's mix of businesses, but allowing for errors in my sector risk measures and changes in business mix, I build a distribution centered around 8.20% but with a small standard error (0.40%).  
Since I want to stay market neutral, taking no stand on either the level of interest rates or overall stock prices, I am leaving the ten-year bond rate and equity risk premium untouched. The results of the simulation are below:

Valuation & Simulation Output
Note that the median, mean and base case valuations are all bunched up at $200 and that the range in value, using the 10th and 90th percentiles, is tight ($176 to $229).

Amazon: A September 2018 Simulation
Moving from Apple to Amazon, my uncertainties multiply partly because my story is of a company that will move into any business where it believes its disruptive platform can deliver results, and there are very few businesses that are immune. Consequently, every input into the valuation is much more volatile, but I will focus on four:
  1. Revenue Growth: I used an expected growth rate for Amazon of 15% a year for the next 5 years, tapering down to lower levels in the future, to push revenues to $626 billion, ten years from now. While that is an ambitious target, Amazon has proved itself capable of beating sky high expectations before and it is plausible that the growth rate could be as high as 25% (which would translate to revenues of $1.13 trillion, ten years out). There is also the possibility that regulators and anti-trust enforcers may step in and restrain Amazon's growth plans, which could cause the growth rate to drop significantly to 5% (resulting in revenues of $330 billion in year 10).
  2. Operating Margin: While Amazon's margins have been on a slow, but steady, climb in the last few years, much of that improvement has come from the cloud services business, and the future course of margins will depend not only on how well Amazon can bring logistics costs under control but also on what new businesses it targets. I will stay with my base cash assumption of a target operating margin of 12.5%, but allow for the possibility that Amazon's margins will stay stagnant (close to today's margins of about 7%), at one extreme, and that there might be a new, very profitable business that Amazon can enter, pushing up the margins above 18%, at the other.
  3. Sales to Invested Capital: Currently, Amazon is an efficient utilizer of capital, generating $5.95 in revenues for every dollar of capital invested. While this will remain my base case, there may be future businesses that Amazon is targeting that may be more or less capital intensive than its current ones, leading to a significant range (3.95 for the more capital intensive - 7.95 to the less  capital intensive).
  4. Cost of Capital: I will stick with my base case cost of capital of 7.97%, with the possibility that that it could drop as Amazon's older businesses become profitable (but not by much, since the current cost of capital is close to the median for global companies) as well as the very real chance that it could go up significantly, if Amazon targets risky businesses in emerging markets for its growth.
Valuation & Simulation Output
The median value across the simulations is $1242, close to the base case valuation of $1,255. The range on value, using the 10th and 90th percentiles is $705 - $2,152, much wider than the range for Apple.

Lessons from Apple and Amazon Simulations
Simulations yield pretty pictures and if that is all you get out of them, it is time and energy wasted. There are lessons that we can eke out of the Apple and Amazon simulations that may help us in making more informed judgments:
  1. This is not about getting better estimates of value: If you are running simulations because you think they will give you more precise or better estimates of value than point estimate valuations, you will be disappointed. Since my input distributions are centered around my base case assumptions, and they should be, the median values across 100,000 simulations are close to my base case valuations for both Apple and Amazon.
  2. If it is a risk proxy, it is a very noisy and dangerous one: It is true that the spread of the distributions provides a measure of estimation uncertainty that you bring into your valuation. Using the Apple and Amazon simulations to illustrate, I face far greater uncertainty with my Amazon story than with my Apple story, and you can see it reflected in a larger range of value for the former. You may be puzzled that my cost of capital is lower for Amazon than for Apple, but that reflects the fact that much of the uncertainty that I face with Amazon is company-specific and should be buffered by other stocks in my portfolio. As a diversified investor, the variance in simulated values is a poor proxy for risk. However, if you are an investor who prefers concentrated portfolios, you can use the variance in simulated value as a measure of risk. 
  3. There can be no one margin of safety for all companies: I have written about the margin of safety before, often with skepticism, and one of my critiques has been with the way it is used in practice, where it is set at a fixed number for all companies. Thus, you will find value investors who use a margin of safety of 15% or 20% for all stocks, and the Apple and Amazon simulations show the danger in this practice. A 15% margin of safety for Apple may be too large, given how tightly values are distributed for the company, whereas the same 15% margin of safety may be too small for Amazon, with its wider band of values.
  4. Tails matter: Symmetry or the lack of it in distributions may seem like an inside statistics topic, but with simulated values, it has investment consequences. You can see that Apple's value distribution is  much more symmetric than Amazon's distribution, with the latter having a significant positive skew, reflecting a greater likelihood of big positive surprises in value, than negative ones. With companies with exposure to large and potentially catastrophic news stories (a large lawsuit or debt covenants), you can have value distributions that are negatively skewed.  In general, positive skewed distributions are better for (long) investors than negatively skewed ones, and the reverse is true for investors who are shorting a company.
I ran the simulations after my base case valuations suggested that Apple and Amazon were over valued, to see how they might affect my decision on whether to sell short on either company. The results are mixed.
  • While the simulations confirm my over valuations (no surprise there), with both companies, the current stock price is well within the realm of possibilities. While my base case valuation suggested that Apple was far less over valued (10%) than Amazon (55%), there is roughly a 15-20% chance that both companies are under valued, not over valued.
  • In addition, with Amazon, there is the added risk, if you are selling short, given the long positive tail on the distribution, that if I am wrong, the price I will pay will be much greater than if I am wrong with Apple.
The bottom line is that while Amazon seemed like a much better short selling target, after my base case valuations, because it was far more over valued than Apple, the simulations that I did on the two companies even out the scales, at least marginally. Apple is more over valued, but the probability of making money, assuming my valuations are on target is about the same with both stocks, and the downside of being wrong is far greater with Amazon than with Apple.

Value and Price: The Search for Catalysts
In the post that initiated this series, I looked at why crossing a trillion-dollar threshold may matter to investors, using the contrast between the value process and the pricing process. In effect, I argued that there can be a gap between value and price, and that even if you are right about your value judgment, you will make money only if the gap between the two closes:

Investment success thus rides not only on the quality of your value judgment, and how much faith you have in it, but on whether there are catalysts that can cause the gap to change. With companies, these catalysts can take different forms:
  1. Earnings reports: In their earnings reports, in addition to the proverbial bottom line (earnings per share), companies provide information about operating details (growth, margins, capital invested). To the extent that the pricing reflects unrealistic expectations about the future, information that highlights this in an earnings report may cause investors to reassess price. 
  2. Corporate news: News stories about a company's plans to expand, acquire or divest businesses  or to update or introduce new products can reset the pricing game and change the gap.
  3. Management Change/Behavior: A change in the ranks of top management or a managerial misjudgment that is made public can cause investors to hit the pause button, and this is especially true for companies that are bound to a single personality (usually a powerful founder/CEO) or derive their value from a key person. 
  4. Macro/ Government: A change in the macro environment or the regulatory overlay for a company can also cause a reassessment of the gap.
With all of these catalysts, there may be value effects (because the cash flows, growth and risk) as well, and it should also be noted that when the gap changes, it may not always close. In fact, these catalysts can sometime make a gap bigger, by feeding into pricing momentum.

As an investor, I look for catalysts when I invest, but I am even more intent on finding them, when I sell short than when I am long a stock. The reason for that divergence is that I am in far greater control of my time horizon, when I buy a stock, since, as long as I stay disciplined and retain faith in my value, only liquidity needs can cause me to sell. When I sell short, my time horizon is far less under my control, exposing me to timing risk. Put different, I can bet on a company being over valued, be right on my thesis, but still lose money on a short sale, because I am forced to close out my position, in the absence of a catalyst.

Going through the list of catalysts with Apple and Amazon, with both stocks approaching all-time highs, there is no obvious pricing trigger than I can point to, though my technical analyst friends will undoubtedly point to indicators that I did not even know existed. On the earnings front, the earnings reports for both companies are so heavily scripted to expectations that it would take a big surprise to reset stories, and I don't see that happening. In fact, I will predict that Amazon's earnings reports will continue to deliver double digit revenue growth and improving margins for the next few quarters, and investors will react positively, even though the growth may not be high enough or the margin improvement substantial enough to justify the market pricing. On the corporate news front, Apple's smart phone business model, with the pressure it puts on the company every year or two to reinvent itself, with the latest and the best, coupled with its big announcement events, creates catalyst moments. Looking back at Apple's ups and downs over the last few years, the triggers for substantial up and down movements on the stock have been new iPhone models doing better or worse than expected. In contrast, Amazon is remarkably low key in new product introductions, preferring to slip in under the radar. Both companies have well regarded and established CEOs, and neither company is personality-driven, making it unlikely that you will see management changes triggering big price changes. Finally, on the macro front, both companies face potential catalyst moments. For Apple, it is the possibility of a trade war with China, a huge market for its products and devices, and for Amazon, it is talk of regulatory restrictions and anti-trust actions that can constrain the company.  Since I cannot filibuster my way to a non-decision, I decided to compare my Apple and Amazon numbers/analysis, side by side:

I sold my Apple shares at $220, at the start of trading on Friday (9/21), but while I have not sold short any more shares. I have put in a limit (short) sell, if the price hits $230 (roughly my 90th percentile of value) in the near future. With Amazon, I sold short at $1950 at the start of trading on Friday (9/21).  the first time in twenty years that I have sold short on the company, and one reason that I am pulling the trigger is because I believe that the pushback from regulators and anti-trust enforcers will slow the company down in ways that no competitor ever could. I am doing so, with open eyes, since I believe that Amazon is in one of the best run companies in the world, adept at setting market expectations and beating them, and with a track record of taking short sellers to the graveyard. Time will tell, and I am sure that some of you reading this post will let me know, if my bet goes awry, but I don't plan to lose any sleep over this. 

YouTube Video


Trillion Dollar Posts


Spreadsheets

  1. Apple valuation and simulation results
  2. Amazon valuation and simulation results
(I use Crystal Ball, an add-on to Excel, for my simulations. If you don't have that extension (available only on the PC version), you cannot recreate my simulations, but you can download the program for a trial run on the Oracle website)

Papers/Reading
  1. Facing up to Uncertainty: Using Probabilistic Approaches in Valuation
  2. Living with Noise: Investing and Valuation in the Face of Uncertainty
Share:

Wednesday, September 19, 2018

Apple and Amazon at a Trillion $: Looking Back and Looking Forward!

For most of us, even envisioning a trillion dollars is difficult to do, a few more zeros than we are used to seeing in numbers. Thus, when Apple’s market capitalization exceeded a trillion on August 2, 2018, it was greeted with commentary, and when Amazon’s market capitalization also exceeded a trillion just over a month later on September 4, 2018, there was more of the same. I have not only admired both companies, but tracked and valued them repeatedly over the last twenty years. There is much that I have learned about business and finance from both companies, and I thought this would be a good occasion to look at how these two companies got to where they are today, as well as their similarities and differences. In the process, I will make my assessment of where Apple and Amazon stand today, and update my valuations and investment judgments on both companies. I am sure that your assessments will be different, but it is of these differences that markets are made.

The Road to a Trillion Dollars

Markets give and markets take away, and this is true not just for the laggards in the market, but even the most successful companies. Apple and Amazon have had amazing runs, but without taking anything away from their success, it is worth noting that during their march towards trillion dollar market capitalizations, each has had to endure periods in the wilderness, and the way they dealt with market adversity is what has made them the companies that they are today.

Apple is the older of the two companies, founded in 1976, and igniting the shift away from mainframe computers to personal computers, first with its Apple computers and later with its Macs. My first personal computer was a Mac 128K, which I still own, and I have been an investor in the stock off and on, for decades. In the chart below, I graph the market capitalization of the company from 1990 to September 2018:

After its auspicious beginnings, Apple endured a decade in the wilderness in the 1990s, after the departure of Steve Jobs, its visionary but headstrong co-founder, in 1975, and a series of inept successors. As testimonial that there are sometimes second acts for both people and companies, Apple found its mojo in the first decade of this century, headed again by Steve Jobs but this time with a stronger supporting cast. That success has continued into this decade, with Tim Cook stepping in as CEO, after the untimely demise of Jobs. In the last few years, the company has also chosen to use its capacity to borrow money, increasing its debt ratio from close to nothing to just over 10% of equity (in market value terms).

Just as Apple presided over one major change in our lives, Amazon’s entrée into markets reflected a different shift, one that has changed the way we buy goods, and, in the process, and has upended the retail business. Amazon's sprint from start-up to trillion dollar value is captured below:
From a barely registering market capitalization in 1996, Amazon zoomed to success during the dot-com boom, but as that boom turned to bust, the company lost more than 80% of its market capitalization in 2000. After its near-death experience in 2000, Amazon spent the bulk of the following decade, consolidating and getting ready for its next phase of growth, increasing its market capitalization almost eight-fold between 2012 and 2018.

Along the way, both companies have had their detractors, who have not only scoffed at the capacity both companies to scale up, but have also sold short on the stock, making both stocks among the most shorted in the market. Little seems to have changed on that front, since Apple and Amazon remain among the most heavily shorted stocks in September 2018, though neither Jeff Bezos nor Tim Cook seems to be paying any attention to the short sellers. (Elon Musk, Please take note!)

The Back Story: Revenues and Operating Income

We can debate whether Amazon and Apple are worth a trillion dollars, but there can be no denying that both companies have been successful in their businesses, and that it is these operating success that best explain their high market values. That said, as we will see in the section following, the way these companies have evolved over time have been very different, and looking at the pathways that they used to get to where they are,  I will lay the foundations for valuing them today.

Revenue Growth and Profitability
Every investigation of operations starts with revenues and operating income, and with Apple, the picture of revenues and operating income over the last three decades illustrates the transformation wrought by its decision to shift away from personal computers to hand held devices, starting with the iPod and then expanding into the iPhone and iPad, in the the last decade:


The revenue growth rate, which languished in the 1990s, zoomed in 2000-08 time period, and operating margins almost doubled. However, it was in the 2009-13 period that Apple saw the full benefits of its rebirth, with operating margins almost quadrupling, with the iPhone being the primary contributor. During the 2014-18 period, the good news for Apple is that margins have stayed mostly intact but it has seen a fairly dramatic drop off in growth, as the smart phone market matures.

The Amazon operating story also starts with revenue growth, but the company's evolution on operating margins has followed a different path from Apple's:
The company's growth was stratospheric in the early years, partly because it was a start-up, scaling up from less than a million dollars in revenues in 1995 to $2.76 billion in 2000. While scaling up did slow down growth, the company weathered the dot com bust to grow revenues at 28.61% a year from 2000 to 2010, with revenues reaching $34.2 billion in 2010. The most impressive phase for Amazon has been the 2011-2018 period, because it has been able to continue to grow revenues at almost the same rate as in the prior decade, but this time with a much larger base, increasing revenues to $208.1 billion in the last twelve months, ending June 2018. On the income front, the story has not been as positive. While the initial losses in try 1990s can be explained by Amazon's status as a young, growth company, it becomes more difficult to justify the continuation of these losses into 2002 (six years after its public listing) and the trend lines in operating margins since then. Rather than improving over time, as economies of scale kick in, which is what you would expect in growth companies, Amazon's margins have not only stayed low but have often headed lower, suggesting either that the company is not reaping scaling benefits or that it is playing a very different game, and my bet is on the latter. 

The Cash Flow Contrast
If you are a value investor, I know that you will probably be taking me to task at this point by noting that you don't get to collect on revenues or operating income and that you invest for the cash flows. That is true, and it is on this dimension the the difference between Apple and Amazon becomes a yawning gap.  With Apple, the evolution of the company from a has-been in the 1990s to a disruptive force in the 2001-2010 period to its more mature phase between 2011 and 2018 plays out in its cash flows. Using the free cash flow to equity, which measures cash left over for equity investors after reinvestment and taxes, as the measure of cash that can potentially be returned to shareholders, here is what I see:

I have described Apple as the greatest cash machine in history and you can see why, by looking at the cumulative cash flows generated by the firm. After getting a start in the 2000-08 time period, the cash machine kicked into high gear between 2009 snd 2013, with $124 billion in free cash flow to equity generated cumulatively over the period. You can also see the company's initial reluctance to return the cash, both in the fact that only about a third of the cash flow during this period was returned in dividends and buybacks and in the increase in the cash balance of just over $122 billion. Prodded by activist investors (Einhorn and Icahn, in particular), the company switched gears and began returning more cash, increasing dividends and buying back more stock. Between 2014 and 2018, the company returned an astonishing $277 billion in cash to investors ($61 billion in dividends and $216 billion in buybacks), which is higher than the $242 billion that the firm generated as free cash flows to equity. While it was returning more cash than any other company has in history, Apple pulled off an even more amazing feat, increasing its cash balance by $96 billion, as it used it dipped into it debt capacity, to borrow almost $100 billion.

Amazon's cash flows are a distinct contrast to Apple's, though you should not be surprised, given the lead up. As noted in the earlier section, it is a company that has gone for higher revenue growth, often at the expense of profit margins, and has been willing to wait for its profits. The graph below looks at net income and free cash flows to equity at the company over its lifetime:

It is not the negative FCFE in the early years that is the surprise, since that is what you would expect in a high growth, money losing company, but the evolution of the FCFE in the later years. Initially, Amazon follows the script of a successful growth company, as both profits and FCFE turn positive between 2001 and 2010, but in the years since, Amazon seems to have reverted back to the cash flow patterns of its earlier years, albeit on a much larger scale, with huge negative free cash flows to equity. During all of this period, Amazon has never paid dividends and bought back stock in small quantities in a few years, more to cover management stock option exercises than to return cash to stockholders.

Story and Valuation

With the historical assessment of Apple and Amazon behind us, it is time to turn to the more interesting and relevant question of what to make of each company today, since Apple and Amazon are clearly are on different paths, with very different operating make ups and at different stages in the life cycle. Apple is a mature company, with low growth, and is behaving like one, returning large amounts of cash to stockholders. Amazon is not just a growing company, but one that seems intent on continuing to grow, even if it means delayed profit gratification. In the section below, I will lay out my story and valuation for each company, with the emphasis on the word "my", since I am sure that you have your own story for each company. I will leave my valuation spreadsheet open for you to download, with the story levers easily changed to reflect different stories. 

Apple: The Smartphone Cash Machine
Apple's success over the last two decades has been largely fueled by one product primarily, the iPhone, and that success has come with two costs. The first is that Apple is now predominately a smart phone company, generating almost 62% of its revenues and an even higher percentage of its profits from the iPhone. The second is that the smart phone business has not only matured, with lower growth rates globally, but is intensely competitive, with both traditional competitors like Samsung and new entrants roiling the business. While there remains a possibility that Apple will find another market to disrupt, I think it will be difficult to do so, partly because with Apple's size, any new disruptive product has to not only be of a big market, but one that is immensely profitable, to make a difference to Apple's cash flow stream.

My story for Apple is therefore relatively unchanged from my story last year, though I am a little bit more optimistic that Apple will be able to use its immense iPhone owner base to sell more services
Download spreadsheet
I am valuing Apple as a mature company, growing at the same rate as the economy in perpetuity, while seeing its operating margins decline from their current level (30%) to about 25% over the next 5 years, and with these assumptions, I estimate a $200 value per share, roughly 9% lower than the $219 stock price on September 18, 2018.

Amazon: The Disruptive Platform
In my earlier valuations of Amazon, I called it a Field of Dreams company, because investing in it required investors to buy into its vision of "if we build it (revenues), they (profits) will come". In my most recent valuation of Amazon, I noted that the company was finally starting to deliver on the second half of the promise, increasing its profits margins, with its cloud business contributing large profits, and significant investments in logistics keeping shipping costs in check. Along the way, and especially since 2012, the company has also moved from being predominantly a retailer of goods and services to one that is unafraid to enter any new business, where it can use its disruptive platform to good effect. In effect, it has seemed to have transitioned from being a disruptive retail company to a disruption platform that can be aimed at other businesses, with an army of Prime members at its command.

My story is that will continue to do more of the same, with high revenue growth coming from new businesses and markets and a continued growth in margins, as established businesses start to find their footing. 
Download spreadsheet
My revenue growth rate of 15% may seem modest, given Amazon's growth rate in the last decade, but note that if this growth rate can be delivered, Amazon's revenues will be $626 billion in 2027, and if it can improve its overall operating margin to 12.5%, its operating profit will be $78 billion in that year. With this story, I estimate a $1,255 value per share for Amazon, well below its market price of $1,944 a share, making it over valued by almost 35%. I will admit, with no shame, that Amazon is a company that I have consistently under estimated, and it is entirely possible, perhaps even plausible, that the real story for Amazon is even bigger (in terms of revenue growth) and more profitable. 

End Game
I have always operated on the premise that if you value companies, you should be willing to act on those valuations. In the case of Apple and Amazon, that would suggest that the next step that I should be taking with each company is to sell. With Apple, a stock that I have held for close to three years and which has served me well over the period, that would be accomplished by selling my holding. With Amazon, a stock that I have not held for more than five years, that would imply joining the legions of short sellers. Like an Avengers' movie, I am going to leave you in suspense until my next post, because I have two loose ends to tie up, before I can act. The first is to grapple with the uncertainties that I have about my own stories for the two companies, and the resulting effects on their valuations. The second is what I will mysteriously term "the catalyst effect", which I believe is indispensable, especially when you sell short. 

YouTube video

Valuation Spreadsheets
Share:

Thursday, February 9, 2017

Apple: The Greatest Cash Machine in History?

As as sports fan, watching Brady and Belichick win the Super Bowl, Roger Federer triumph at the Australian Open and LeBron James carry the Cleveland Cavaliers to victory over the Warriors, it struck me how we take uncommon brilliance for granted. It is so easy, in the moment, to find fault, as many have, with these superstars and miss how special they are. That was the same reaction that I had as I watched another earnings report from Apple and the usual mix of reactions to it, some ho hum that the company made only $45 billion last year, some relieved that the company was able to post a 3% growth rate in revenues and the usual breast beating from those who found fault with it for not delivering another earth-shaking disruption. Since this is a company that I have valued after every quarterly earnings report since 2010, I thought this would be a good time to both take stock of what the company has managed to do over the last decade and to value it, given where it stands today.

The Cash Machine Revs up
In my last post on dividend payout and cash return globally, I noted that large cash balances don't happen by accident but are a direct result of companies paying out less than they have available as potential dividends or free cash flows to equity, year after year. Since Apple's cash balance almost reached $250 billion in its most recent quarterly report, by far the largest cash balance ever accumulated by a publicly traded company, I decided that the place to start was by looking at how it got to its current level. I started by collecting the operating, debt financing and reinvestment cash flows each year from 2007 to 2016 and computing a free cash flow to equity (or potential dividend) each year.
Starting in 2013, when Apple started to tap into its debt capacity, the company has been able to add to its potential dividends each year. In 2015 alone, Apple generated $93.6 billion in FCFE or potential dividends, an astounding amount, larger that the GDP of half the countries in the world in 2015. Each year, I also looked at how much Apple has returned to stockholders in the form of dividends and stock buybacks.
Note that while Apple took a while to start returning cash, and it needed prompting from David Einhorn and Carl Icahn, it not only initiated dividends in 2012 but has supplemented those dividends with stock buybacks of increasing magnitude each year. In fact, Apple returned $183 billion in cash to stockholders in the last five years, making it, by far, the largest cash-returner in the world over that period.

There are two amazing (at least to me) aspects to this story. The first is that in spite of the immense amounts of cash that Apple has returned each year, its cash balance has increased each year, partly because its operating cash flows are so high and partly because they are being supplemented by debt payments. You can see the cash build up between 2007 and 2016 in the chart below:

Note that while Apple was returning $183 billion in cash between 2013-2016, its cash balance continued to increase, as its cash inflows increased even more.  If having a cash spigot that never turns off is a problem, Apple has it, but I am sure that it will not get about as much sympathy from the rest of the world as a supermodel who complains that she cannot put on weight, no matter how much she eats. The other equally surprising feature of this story is that Apple's managers have not felt the urge (yet) to use their huge cash reserves to buy a company, a whole set of companies or even an entire country, a fact that those who like Apple will attribute to the discipline of its management and Apple haters will argue is due to a lack of imagination.

My Apple Valuation History
As many of you who have been reading this blog are aware, I have valued Apple many times before but rather than rehash old history, let me summarize. For Apple, the story that I have been telling about the company for the last five years has been remarkably unchanged. In my July 2012 valuation, where I looked at Apple just after it had become the largest market cap company in the world and had come off perhaps the greatest decade of disruption of any company in history (iTunes, iPod, iPhone and iPad), I concluded that while Apple was one of the great cash machines of all time, its days of disruption were behind it, partly because Steve Jobs was no longer at the helm but mostly because of its size; it is so much more difficult for a $600 billion company to create a significant enough disruption to change the trend lines on earnings, cash flows and value. 

So, in my story, I saw Apple continuing to produce cash flows, with low revenue growth and gradually decreasing margins, as the smartphone business became more competitive. I won't make you read all of the posts that I have on Apple, but let me start with a post that I had in August 2015, when I updated the Apple story (and looked at Facebook and Twitter at the same time). The value I estimated for Apple in that post was $130, higher than the stock price of $110 at the time, prompting me to buy the stock. I revisited the story after an earnings report from Apple in February 2016 and compared it to Alphabet. At the time, I valued Apple at about $126 per share, well above the $94/share that it was trading at the time. In May 2016, Carl Icahn, a long time bull on Apple sold his shares, and Warren Buffett, a long time avoider of tech companies, bought shares in the company. In a post at the time, I argued that while these big names entering and exiting the stock may have pricing consequences, I saw no reason to change my story and thus my value, leaving my Apple holdings intact. 

Apple's Earnings Report & My Narrative
Last week, Apple released its latest 10Q and in conjunction with its latest 10K (Apple's fiscal year end is in September). It contained a modicum of good news, insofar as there was growth in revenues as opposed to the decline posted in the prior quarter and still-solid profit margins, but the revenue growth was only 3% and the margins are still lower than they used to be.  Using the numbers in the most recent report, I took at look at my Apple story and guess what? It looks just like it did last year, a great cash machine, with very slow-growing revenues and declining margins. Using the process that I describe, perhaps in too much detail in my book on narrative and numbers, I converted my story in inputs to my valuation:

Some of you may find my story too cramped , seeing a greater possibility than I do of Apple breaking through into a new, big market (with Apple Pay or the Apple iCar). If you are in that group, please take my structure and make it yours, with a higher growth rate coming from your disruptive story, accompanied by lower margins and higher reinvestment. Others may find this story too optimistic, perhaps seeing a more precipitous fall of profit margins in the smart phone business and a greater tax liability from trapped cash. You too can alter the inputs to your liking and make your own judgment on Apple!

An Updated Valuation of Apple
Once you have a story for a company and convert that story into valuation inputs, the rest of the process becomes just mechanics. In the picture below, I have my February 2017 valuation of Apple. 
Download spreadsheet with valuation
Just as my valuation looked too optimistic a year, when the earnings report contained darker news, it may seem too pessimistic this year, after a much sunnier report. That said, it is worth emphasizing how much Apple is on the iPhone roller coaster ride, reporting better earnings in the quarters immediately after a new iPhone is released and much worse earnings in the quarters thereafter. While the market seems to want to go on a ride with Apple on its ups and downs, my fundamental story for Apple has barely shifted in the last few years and my valuations reflect that story stability.

Apple's Price/Value Dynamics
I have taken my share of punishment on investments that have not gone well, with Valeant being a source of continuing pain (which I will return to after its next earnings report). Apple, though, has served me well in the last decade, but even with Apple, I have had extended periods where my faith has been tested. The picture below graphs Apple's stock price from 2010 and 2017 with my valuations shown across time:

I held Apple from 2010 to 2012, as it traded under my estimated value. I sold in April 2012, just before a brief interlude where the price popped above value in June 2012, it reverted back to being under valued until June 2014. After spending a few months as an overvalued stock, the price plummeted in the late summer of 2015, making me a buyer, but it continued to drop until almost April 2016. It's been a good ride since, and much as I want to attribute this to my valuation insights and brilliant timing, I have a sneaking suspicion that luck had just as much or perhaps more to do with it. Now that the stock is fully valued, decision time is fast approaching and I am ready with my sell trigger at $140/share, the outer end of the range that I have for Apple's value today.

Conclusion
Apple is the greatest corporate cash machine in history and it is fully deserving of its market value. Its history as a disruptive force has led some investors to expect Apple to continue what it did a decade ago and come up with new products for new markets. Those expectations, though, don't factor in the reality that as a much larger player with huge profit margins, Apple is more likely to be disrupted than be disruptor. Until investors learn to live with the company, as it exists now and not the company that they wish would exist in its place, there will continue to be mood swings in the market translating into the ebbs and flows of its stock price, and I hope to take advantage of them.

YouTube


My book
  1. Narrative and Numbers (Columbia University Press)

Prior Blog Posts on Apple
  1. Narrative Resets: Revisiting a Tech Trio (August 2015)
  2. Race to the top: The Duel between Apple and Alphabet (February 2016)
  3. Icahn exits, Buffett enters: Whither Apple? (June 2016)
Spreadsheets
  1. Apple: FCFE, Dividends and Cash Build up - 1988-2016
  2. Apple: Valuation in February 2017
Share:

Labels

Blog Archive

Recent Posts

Unordered List

Theme Support