• This is default featured slide 1 title

    Go to Blogger edit html and find these sentences.Now replace these sentences with your own descriptions.This theme is Bloggerized by Lasantha Bandara - Premiumbloggertemplates.com.

  • This is default featured slide 2 title

    Go to Blogger edit html and find these sentences.Now replace these sentences with your own descriptions.This theme is Bloggerized by Lasantha Bandara - Premiumbloggertemplates.com.

  • This is default featured slide 3 title

    Go to Blogger edit html and find these sentences.Now replace these sentences with your own descriptions.This theme is Bloggerized by Lasantha Bandara - Premiumbloggertemplates.com.

  • This is default featured slide 4 title

    Go to Blogger edit html and find these sentences.Now replace these sentences with your own descriptions.This theme is Bloggerized by Lasantha Bandara - Premiumbloggertemplates.com.

  • This is default featured slide 5 title

    Go to Blogger edit html and find these sentences.Now replace these sentences with your own descriptions.This theme is Bloggerized by Lasantha Bandara - Premiumbloggertemplates.com.

Showing posts with label IPO. Show all posts

Monday, April 15, 2019

Uber's Coming out Party: Personal Mobility Pioneer or Car Service on Steroids?

After Lyft’s IPO on March 29, 2019, it was only a matter of time before Uber threw its hat in the public market ring, and on Friday, April 12, 2019, the company filed its prospectus. It is the first time that this company, which has been in the news more frequently in the last few years than almost any publicly traded company, has opened its books for investors, journalists and curiosity seekers. As someone who has valued Uber with the tidbits of information that have hitherto been available about the company, mostly leaked and unofficial, I was interested in seeing how much my perspective would change, when confronted with a fuller accounting of its performance.

Backing up!
To get a sense of where Uber stands now, just ahead of its IPO, I started with the prospectus, which weighing in at 285 pages, not counting appendices, and filled with pages of details, can be daunting. It is a testimonial to how information disclosure requirements have had the perverse consequence of making the disclosures useless, by drowning investors in data and meaningless legalese. I know that there are many who have latched on to the statement that "we may not achieve profitability" that Uber makes in the prospectus (on page 27) as an indication of its worthlessness, but I view it more as evidence that lawyers should never be allowed to write about investing risk.

Uber's Business
Just as Lyft did everything it could, in its prospectus, to relabel itself as a transportation services (not just car services) company, Uber's catchword, repeatedly multiple times in its prospectus, is that it is a personal mobility business, with the tantalizing follow up that its total market could be as large as $2 trillion, if you count the cost of all money spent on transportation (cars, public transit etc.)
Uber Prospectus: Page 11
While the cynic in me pushes me back on this over reach (I am surprised that they did not include the calories burnt by the most common transportation mode on the face of the earth, which is walking from point A to point B, as part of the total market), I understand why both Lyft and Uber have to relabel themselves as more than car service companies. Big market stories generally yield higher valuation and pricing than small market stories!

The Operating History
Uber went through some major restructuring in the three years leading into the IPO, as it exited cash burning investments in China (settling for a 20% stake in Didi), South East Asia (receiving a 23.2% share of Grab) and Russia (with 38% of Yandex Taxi the prize received for that exit). It is thus not surprising that there are large distortions in the financial statements during the last three years, with losses in the billions flowing from these divestitures. In the last few weeks, Uber announced a major acquisition, spending $3.1 billion to acquire Careem, a Middle Eastern ride sharing firm. Taking the company at its word, i.e., that the large divestiture-related losses are truly divestiture-related, let’s start by tracing the growth of Uber in the parts of the world where it had continuing operations in 2016, 2017 and 2018:
Uber Prospectus: Page 21
The numbers in this table are the strongest backing for Uber’s growth story, with gross billings, net revenues, riders and rides all increasing strongly between 2016 and 2018. That good news on growing operations has to be tempered by the recognition that Uber has been unable to make money, as the table below indicates:
Uber Prospectus: Pages 21 & 24
The adjusted EBITDA column contains numbers estimated and reported for the company, with a list of adjustments they made to even bigger losses to arrive at the reported values. I convert this adjusted EBITDA to an operating income (loss) by first netting out depreciation and amortization (for obvious reasons) and then reversing the company’s attempt to add back stock based compensation. The company is clearly a money loser, but if there is anything positive that can be extracted from this table, it is that the losses are decreasing as a percent of sales, over time.

The Rider Numbers
One of Uber’s selling points lies in its non-accounting numbers, as the company reported having 91 million monthly riders (defined as riders who used either Uber or Uber delivery at least once in a month) and completing 5.2 billion rides. To break down those daunting numbers, I focus on the per rider statistics to see the engines driving Uber’s growth over time:
Uber Prospectus: Page 21
There is good and bad news in this table. The good news is that Uber’s annual gross billings per rider rose almost 28% over the three year period, but the sobering companion finding is that the billings/ride are decreasing. Boiled down to basics, it suggests that the growth in overall billings for the company is at least partially driven by existing riders using more of the service, albeit for shorter rides. It could also reflect the fact the new riders for the company are coming from parts of the world (Latin America, for instance), where rides are less expensive.  Finally, I took Uber’s expense breakdown in their income statement, and used it to extract information about what the company is spending money on, and how effectively:
Uber Prospectus: F-4 (income statement in appendix)
I make some assumptions here which will play out in the valuation that you will see below.
  1. User Acquisition costs: Using the assumption that user change over a year can be attributed to selling expenses during the year, I computed the user acquisition cost each year by dividing the selling expenses by the number of riders added during the year.
  2. Operating Expenses for Existing Rides: I have included the cost of revenues (not including depreciation) and operations and support as expenses associated with current riders. 
  3. Corporate Expenses; These are expenses that I assume are general expenses, not directly related to either servicing existing users or acquiring new ones and I include R&D, G&A and depreciation in this grouping.
The good news is that the expenses associated with servicing existing users has been decreasing, as a percent of revenues, indicating that not all of these costs are variable or at least directly linked to more rider usage. Also, corporate expenses are showing evidence of economies of scale, decreasing as a percent of revenues. The bad new is that the cost of acquiring new users has been increasing, at least over this time period, suggesting that the ride sharing market is maturing or that competition is picking up for riders.

More than ride sharing?
Uber is a more complicated company to value than Lyft, for two reasons. The first is that Uber is not a pure ride sharing company, since it derives revenues from its food delivery service (Uber Eats) and an assortment of other smaller bets (like Uber Freight). In the graph below, you can see the evolution of these businesses:
Uber Prospectus: Page 114

It is worth noting this table while suggests that while some of Uber’s more ambitious reaches into logistics have not borne fruit, its foray into food delivery seems to be picking up steam. Uber Eats has expanded from 2.68% of Uber’s net revenues to 13.12%. There is some additional information in another portion of the prospectus, where Uber reports its "adjusted" net revenue and gross Billings by business, and it does look like Uber's net take from Uber Eats is lower than its take from ride sharing:
Uber Prospectus: Pages 102 & 103
While it is clear that Uber's ride sharing customers have been quick to adopt Uber Eats, there are subtle differences in the economics of the two businesses that will play out in future profitability, especially if Uber Eats continues to grow at a disproportionate rate.

Unlike Lyft, which has kept its focus on the US and Canadian markets, Uber's ambitions have been more global, though reality has put a crimp on some of its expansion plans. While Uber's initial plans were to be everywhere in the world, large losses have led Uber to abandon much of Asia, leaving China to Didi and South East Asia to Grab, with India being the one big market where Uber has stayed, fighting Ola for market share and who can lose more money. The fastest growing overseas market for Uber has been Latin America, as you can see in the graph below:

Uber does not provide a breakdown of profitability by geographical region, but the magnitude of the losses that they wrote off when they closed their Chinese and South East Asian operations suggests that the US remains their most lucrative ride sharing market, in terms of profitability. 

The Road Ahead : Crafting a story and value for Uber
1. A Top Down Valuation
In valuing Lyft, I used a top-down approach, starting with US transportation services as my total accessible market and working down through market share, margins and reinvestment to derive a value of $13.9 billion for its operating assets and $16.4 billion with the IPO proceeds counted in. Using a similar approach is trickier for Uber, since its decision to be in multiple parts of the logistics business and its global ambitions require assessment of a global logistics market, a challenge. I did an initial assessment of Uber, using a much larger total market and arrived at a value of $44.4 billion for its operating assets, but adding the portions of Didi, Grab and Yandex Taxi pushed this number up to $55.3 billion. Adding the cash balance on hand as well as the IPO proceeds that will remain in the firm (rumored to be $9 billion), before subtracting out debt yields a value for equity of about $61.7 billion.
The share count is still hazy (as the multiple blank areas in the prospectus indicate) but starting with the 903.6 million shares of common stock that will result from the conversion of redeemable convertible preferred shares at the time of the IPO, and adding in additional shares that will result from option exercises, RSUs (restricted stock units issued to employees) and new shares being issued to raise approximately $10 billion in proceeds, I arrive at a value per share of about $54/share, though  that the updated version of the prospectus, which should come out with the offering price, should allow for more precision on the share count.

2. A Rider-based Valuation
The uncertainty about the total accessible market, though, makes me uneasy with my top down valuation. So, I decided to try another route. In June 2017, I presented a different approach to valuing companies like Uber, that derive their value from users, subcribers or members. In that approach, I began by valuing an existing user (rider), by looking at the revenues and cash flows that Uber would generate over the user’s lifetime and then extended the approach to valuing a new user, where the cost of user acquisition has to be netted out against the user value. I completed the assessment by computing the value drag created by non-rider related costs (like G&A and R&D). In the June 2017 valuation, I had to make do with minimalist detail on expenses but the prospectus provides a much richer break down, allowing me to update my user-based valuation of Uber. The valuation picture is below:
This approach yields a value for the equity of about $58.6 billion for Uber’s equity, which again depending on the share count would translate into a share price of $51/share.

Value Dynamics
The benefits of the rider-based valuation is that it allows us to isolate the variables that will determine whether Uber turns the corner quickly and can make enough money to justify the rumored $100 billion value. The value of existing riders is determined by the growth rate in per-user revenues and the cost of servicing a user, with increases in the former and decreases in the latter driving up user value.  The value of new riders, in the aggregate, is determined by the increase in rider count and the cost of acquiring a new rider. One troubling aspect of the growth in users over the last three years has been the increase in user acquisition costs, perhaps reflecting a more saturated market. In the table below, I estimate the value of Uber's equity, using a range of assumptions for the growth rate in per user revenues and the cost of acquiring a new user:
Download spreadsheet
There are two ways that you can read this table. If you are a trader, deeply suspicious of intrinsic value, you may look at this table as confirmation that intrinsic value models can be used to deliver whatever value you want them to, and your suspicions would be well founded. I am a believer in value and I see this table in a different light.
  • First, I view it as a reminder that my estimate of value is just mine, based on my story and inputs, and that there are others with different stories for the company that may explain why they would pay much more or much less than I would for the company. 
  • Second, this table suggests to me that Uber is a company that is poised on a knife's edge. If it just continues to just add to its rider count, but pushes up its cost of acquiring riders as it goes along, and existing riders do not increase the usage of the service, its value implodes. If it can get riders to significantly increase usage (either in the form of more rides or other add on services), it can find a way to justify a value that exceeds $100 billion. 
  • Third, the table also indicates that if Uber has to pick between spending money on acquiring more riders or getting existing riders to buy more of its services, the latter provides a much bigger bang for the buck than the former. 
Put simply, I hope Dara Khoshrowshahi means it when he says that Uber has to show a pathway to profitability, but I think that is what is more critical is that he acts on those words. In my view, this remains a business, whether you define it to be ride sharing, transportation services or personal mobility, without a business model that can generate sustained profits, precisely because the existing model was designed to deliver exponential growth and little else, and Uber, and the other players in this game), have only a limited window to fix it.


Refreshing the Pricing
Having spent all of this time on Uber's valuation, let me concede to the reality that Uber will be priced by the market, and it will be priced relative to Lyft. That is why Uber has probably been pulling harder than almost any one else in the market for the Lyft IPO to be well received and for its stock to continue to do well in the aftermarket. In the table below, I compare key operating numbers for Uber and Lyft, with Lyft's pricing in the market in place:

In computing the metrics, it is worth remembering that Uber and Lyft use different definitions for basic metrics and I have tried to adjust. For instance, Uber defines riders as those who use the service at least once a month and the closest number that I can get for Lyft is their estimate that they had 18.6 million active quarterly riders. Uber is bigger on every single dimension, including losses, then Lyft. I convert Lyft's current market pricing (on April 12, 2019) into multiples, scaling them to different metrics and applying these metrics to Uber:
Download pricing spreadsheet
In computing Uber's equity value from its enterprise value, I have added the cash ($6.4 billion of cash on hand plus the $9 billion in expected IPO proceeds) $ and Uber's cross holdings ($8.7 billion) to the value and netted out debt ($6.5 billion). To get the value per share, I have used the estimated 1175 million shares that I believe will be outstanding, including options and RSUs, after the offering. Depending on the metric that I can scale it to, you can get values ranging from $47 billion to $124 billion for Uber's equity, though each comes with a catch. If you believe that there are no games that are played with pricing, you should think again! Also, as Lyft's price moves, so will Uber's, and I am sure that there are many at Uber (and its investment banks) who are hoping and praying that Lyft's stock does not have many more days like last Thursday, before the Uber IPO hits the market.

Conclusion
I am sure that there are many who understand the ride sharing business much better than I do, and see obvious limitations and pitfalls in my valuations of both Uber and Lyft.  In fact, I have been wrong before on Uber, as Bill Gurley (who knows more about Uber than I ever will) publicly pointed out,  and I am sure that I will be wrong again.  I hope that even if you disagree with me on my numbers, the spreadsheets that are linked are flexible enough for you to take your stories about these companies to arrive at your value judgments.

Share:

Thursday, March 7, 2019

Lyft Off? The First Ride Sharing IPO!

Last week, Lyft became the first of the ride sharing companies to announce plans for an initial public officering, filing its prospectus. It is definitely not going to be the last, but its fate in the market will not only determine when Uber, Didi, Ola and GrabTaxi will test public markets, but what prices they can hope to get. My fascination with ride sharing goes back to June 2014, when I tried to value Uber and failed spectacularly in forecasting how much and how quickly ride sharing would change the face of car service around the world. I have since returned multiple times to the scene of my crime, and while I am not sure that I have learned very much along the way, I have tried to right size my thinking on this business. You can be the judge as bring my experiences to play in my valuation of Lyft, ahead of its IPO pricing.

The Rise of Ride Sharing
The ride sharing business, as we know it, traces its roots back to the Bay Area, with the founding of Uber, Sidecar and Lyft providing the key impetus, and its impact on the car service business has been immense. In a post in 2015, I traced out the growth of ride sharing and the ripple effects it has had on the car service status quo, noting that revenues for ride sharing companies have climbed, the price of a taxi cab medallion in New York city has plummeted by 80-90%. The most impressive statistic, for ride sharing companies, is not just the growth in revenues, which has been explosive, but also how much it has become part of day-to-day life, not just for younger, more tech savvy individuals but for everyone.  While the growth was initially in the United States, ride sharing has taken off at an exponential rate in Asia, with India (Ola), China (Didi) and Malaysia (GrabTaxi) all developing home grown ride sharing companies. The regulatory push back has been strong in Europe, slowing growth, but there are signs that even there, ride sharing is acquiring a foothold.

There are many factors that can explain how and why ride sharing so quickly and decisively disrupted the taxi cab business, but the latter was ripe for the taking for may reasons. First, the taxi business in the 2009 had changed little in decades, refusing to incorporate advance in technology and shifting tastes, secure that it did not have to adapt, because it had a captive market.  Second, in most cities, rules and regulations that were throwbacks in time or lobbied for by special interests handicapped taxi operators and gave ride sharing companies, not bound by the same rules, a decisive advantage. Third, automobiles are underutilized resources for the most part, since most cars sit idle for much of the day, and ride sharing companies took advantage of excess capacity, by letting car owners monetize it. Finally, individuals often under price their time and do not factor in long term costs in their decision making and the ride sharing companies have exploited that irrationality. I think that the MIT study in February 2018 that showed absurdly low hourly wages (less than $4/hour) for Uber and Lyft drivers was flawed, but I also don't buy into the rosy picture that the ride sharing companies paint about the income potential in driving. 

It has not been all good news for ride sharing, as usage has increased. While revenues have come easily, the companies have struggled with profitability, reporting huge losses as they grow. Lyft reported losses of $911 million in 2018, in its prospectus, but Uber's loss was $1.8 billion during 2018, Didi almost matched that with a $1.6 billion loss and the only reason that Ola and GrabTaxi lost less was because they were smaller. Put simply, these company are money losing machines, at least at the moment, and if there are economies of scale kicking in, they are showing up awfully slowly. While some of this can be attributed to growing pains, that will ease as these companies age and grow bigger, a significant portion of the profitability shortfall can be attributed to how these businesses are designed. In my 2015 post, I argued that the low capital intensity (where ride sharing companies don't invest in cars) and the independent contractor model (where drivers are not employees), which made growth so easy, also conspired to make it difficult for these companies to gain economies of scale or stay away from cut throat competition. 

The Playing Field
In 2015, I argued, with tongue only half in cheek, that one possible model for the ride sharing companies to develop sustainable businesses was the Mafia's mostly successful attempt to stop intrafamily warfare in the 1930s by dividing up New York city among five families, giving each family its own fiefdom to exploit. (I prefer The Godfather version.). While that may have seemed like an outlandish comparison in 2015, it is interesting that in the years since, Uber has extricated itself from China, leaving that market to Didi, in return for a 20% stake in the company and then from South East Asia, in return for a share of GrabTaxi. In fact, the United States may be the most competitive ride sharing market in the world, with Uber and Lyft going head-to-head in most cities.

While Uber and Lyft are ride sharing companies, their evolution over the last decade offers a fascinating contrast in business models, for young companies. In a post in 2015, I drew the contrast between the two companies, as a prelude to valuing them. Uber was the "big story" company, telling investors that it wanted to be in all things logistics, expanding into delivery and moving, and all over the world. Lyft was the "focused story" company, setting itself apart from Uber by keeping its business in the United States and staying with car service, as its primary business.  I argued in 2015, that given how the two companies were priced, I would rather be an investor in Lyft than Uber. 

In the four years since the post, we have seen the consequences for both companies. While Uber's bigger story gained it a much higher pricing from investors, it has also brought the company a whole host of troubles, ranging from being a target for regulators to management over reach. Travis Kalanick, its high profile CEO, left the company in a messy and public divorce, and Dara Khosrowshahi, who replaced him, has scaled Uber's ambitions down, first globally by getting out of China and Southeast Asia, where it was burning through cash at an exponential rate, and then within the logistics business, by focusing on Uber Delivery as the key add on to car service. Lyft has stayed true to its US and car service focus, and it has paid off in a higher market share in the market. Both companies have jumped on the bike and scooter craze, with Uber buying Jump and Lime and Lyft acquiring Motivate. From the looks of it, neither company seems willing to concede to the other in the US market, and this fight will be fought on multiple fronts, in the years to come.

The Lyft Valuation
When valuing young companies, it is the story that drives your numbers and valuation, not historical data or current financials. I have stayed true to this perspective, in all of the valuations that I have done on ride sharing companies. In this section, I will lay out my story for Lyft, drawing on past behavior and the clues that are in their current plans, but it would be hubris to argue that I have a monopoly on the truth and a claim on the "right" story. So, feel free to disagree with me and you can use my valuation spreadsheet to reflect your disagreements.

The Story
Reviewing Lyft's (very long) prospectus, I was struck by the repetition of the mantra that it saw its future as a "US transportation" company, suggesting that the focus will remain primarily domestic and focused on transportation. While the cynical part of me argues that Lyft's use of the word "transportation" is intended to draw attention to the size of that market, which is $1.2 trillion, Lyft's history backs up their "focused" story. While I am normally leery of management stories for companies, I will adopt Lyft's story with a few changes:
  1. It will stay a US transportation services company: The total market that I assume for US transportation services is $120 billion at the moment, well over two and a half times larger than the taxi cab market was in 2009. That is, of course, well below the size of the transportation market, but the $1.2 trillion that Lyft provides for that market includes what people spend on acquiring cars and does not reflect that they would pay for just transportation services.
  2. In a growing transportation services market: One of the striking features of the ride sharing revolution is how much it has changed consumer behavior, drawing people who would normally never have used car service into its reach. I will assume that ride sharing will continue to draw new customers, from mass transit users to self-drivers, causing the transportations services market to double over the next ten years.
  3. With strong market-wide networking benefits: In 2014, when I first valued Uber, I argued that ride sharing companies would have local, but not market-wide, networking benefits. In effect, I saw a market where six, eight or even ten ride sharing companies could co-exist, each dominating different local markets. Observing how quickly the ride sharing companies have consolidated, over the last few years, I think that I was wrong and that the networking effects are likely to be market-wide. Ultimately, I see only two or three ride sharing companies dominating the US ride sharing market, in steady state. In my story, I see Lyft as one of the winners, with a 40% market share of the US transportation services market.
  4. A sustained share of Gross Billings: The concentration of the market among two or three ride sharing companies will also give them the power to hold the line on the percentage of gross billings. That percentage, which was (arbitrarily) set at 20% of gross billings, when the ride sharing companies came into being, has morphed and changed with the advent of pooled rides and how the gross billing number is computed. Lyft, for instance, in 2018, reported revenues of $2,156 million on gross billings of $8.054 million, working out to a 26.77% share. I will assume that as Lyft continues to grow and offers new services, this number will revert back to 20%.
  5. And a shift to drivers as employees: Since their inception, the ride sharing companies have been able to maintain the facade that their drivers are independent contractors, not employees, thus providing the company legal cover, when drivers were found to be at fault of everything from driving infractions to serious crimes, as well as shelter from the expenses that the would ensue if drivers were treated as employees. As the number who work for ride sharing companies rises into the millions, states are already starting to push back, and in my view, it is only a matter of time before ride sharing companies are forced to deal with drivers as employees, causing operating margins in steady state to drop to 15%.
There are some aspects of this story that some of you may find too pessimistic, and other aspects that others may find too optimistic. You are welcome to download the spreadsheet and make the story your own,

The Valuation
The story that I have for Lyft already provides the bulk of the inputs that I need to value the company. To complete the valuation, I add four more inputs related to the company:
  1. Cost of capital: Rather than try to break down cost of capital into its constituent parts for a company that is transitioning to being a public company, I will take a short cut and give Lyft the cost of capital of 9.97%, at the 75th percentile of all US companies at the start of 2019, reflecting its status as a young, money-losing company. I will assume that this cost of capital will drift down towards the median of 8.24% for all US companies as Lyft becomes larger and profitable.
  2. Sales to capital: While Lyft will continue to operating with a low capital-intensity model, its need for reinvestment will increase, to build competitive barriers to entry and to preserve market dominance. If autonomous cars become part of the ride sharing landscape, these investment needs will become greater, I will assume revenues of $2.50 for every dollar of capital invested, in keeping with what you would expect from a technology company.
  3. Failure rate: Given that Lyft continues to lose money, with no clear pathway to generating profits, and that it will remain dependent on external capital providers to stay a going concern, I will assume that there is a 10% chance that Lyft will not survive as a going concern
  4. Share Count: Lyft posits that it will have 240.6 million shares outstanding, including both the class A shares that will be offered to the public and the class B shares, with higher voting rights, that will be held by the founders. It also discloses that it did not include in the share count two share overhangs: (1) 6.8 million shares that are subject to option exercise, with a strike price of $4.68, and (2) 31.6 million restricted shares that had already been issued to employees, but have not vested yet. I will include both of these in shares outstanding, the options because they are so deep in the money that they are effectively outstanding shares and the restricted stock because I assume that the employees that have large numbers of RSUs will stay until vesting, to arrive at a total share count is 279.03 million.
Finally, the company has not made explicit how much cash it hopes to raise from the initial public offering, but I have used the rumored value of $2 billion in new proceeds, which will be kept in the firm to cover reinvestment and operating needs, according to the prospectus. With these assumptions in place, my valuation of Lyft is below:
Download spreadsheet
My story for Lyft leads to a value of equity of approximately $16 billion, with the $2 billion in proceeds includes, or $14 billion, prior to the IPO cash infusion. Dividing by the 279 million shares outstanding, computed by adding the restricted shares outstanding to the share count that the company anticipates after the IPO, yields a value per share of about $59. Any story about young companies comes with ifs, ands and buts, and the Lyft story is no exception. I remain troubled by the ride sharing business model and its lack of clear pathways to profitability, but I think Lyft has picked the right strategy of staying focused both geographically (in the US) and in the transportation services business. I also am leery of the special voting rights that the founders have carved out for themselves, but that seems to have now become par for the course, at least with young tech companies. Finally, the possibility that one of the big technology companies or even an automobile company may be tempted to enter the business remains a wild card that could change the business.

The Lyft Pricing
I am a realist and know that when the stock opens for trading on the offering day, it is not value that will determine the opening bid, but pricing. In the pricing game, investors look at what others are paying for similar companies, scaling to some common operating variable. With publicly traded companies in mature sectors, this takes the form of an earnings (PE), cash flow (EV/EBITDA) or book value (Price to Book) multiple that can then be compared across companies. With Lyft, investors will face two challenges.

  • The first is that it is the first ride sharing company to list, and the only pricing that we have for other ride sharing companies is from venture capital rounds that are sometimes dated (from the middle or early last year). 
  • The second is that every company in the ride sharing business is losing money and the book values have no substance (both because the companies are young and don't invest much in physical assets). 
Notwithstanding these limitations, investors will still try, by scaling to any operating number that they can find that is positive, as I have tried to do in the table below:

It is true that there is substantial noise in the VC pricing numbers and that the operating numbers  for some of these companies are rumored or unofficial estimates. That said, desperation will drive investors to scale the VC pricing to one of these numbers with the gross billings, revenues and number of riders being the most likely choices. Uber has the highest pricing/rider and that the metric is lowest for the Asian companies, which have far more riders than their US counterparts; the revenue per rider, though, is also far lower in Asia than in the US. The companies all trade at high multiples of revenues and more moderate multiples of gross billings. In the table below, I have priced Lyft, using Uber's most recent pricing metrics as well as global averages, both simple and weighted:

To the extent that you accept these metrics, the pricing for Lyft can range from $5 billion to $22 billion, depending on your peer comparison (Uber, Global average, Global weighted average) and your scaling variable (Gross Billings, revenues or riders). In fact, if I bring in the rumored pricing of Uber ($120 billion) into the mix, defying circular logic, I can come up with pricing in excess of $30 billion for Lyft.  I think that they are all flawed, but you should not be surprised to see Lyft and its bankers to focus on the comparisons that yield the highest pricing.

Given the way the pricing game is structured, the pricing of the Lyft IPO is going to be watched closely by the rest of the ride sharing companies, since there will be a feedback effect. In fact, I think of pricing as a ladder, where if you move one rung of the ladder, all of the other rungs have to move as well. For instance, if investors price Lyft at $25 billion, about 12 times its revenue in 2018, Uber will be quicker to go public and will expect markets to attach a pricing in excess of $130 billion to it, given that its revenues were more than $11 billion in 2018. The Asian ride sharing companies, where rider numbers are high, relative to revenues, will try to market themselves on rider numbers, though it is not clear that investors will buy that pitch. Conversely, if investors price Lyft at only $12 billion, Uber may be tempted to wait to go public, and continue to tap into private investors, with the caveat being that those investors will also lower their pricing estimates. The pricing ladder can lead prices up, but they can also lead prices down, and timing is the name of the game.

The Waiting Game
It is still early and there is much that we still do not know. While some of the uncertainties will not be resolved in the near future, we will learn more specifics about the offering itself, including the amount that Lyft plans to raise on the offering day, over the next few weeks. Sometime soon, we will also get the a pricing of the company from the bankers that have been given the task of taking the company public, and I use the word "pricing" rather than "valuation" deliberately. The bankers' job is to price the company for the IPO, not value it. Not only should any talk of value from them be discounted, but if you do see a discounted cash flow valuation from a bank for Lyft, you can almost bet that it will be a Kabuki valuation, where they will go through the motions of estimating valuation inputs, when the ending number has been pre-decided.

Share:

Friday, March 23, 2018

Spotify Loose Ends: Pricing, User Value and Big Data!

In my last post, I valued Spotify, using information from its prospectus, and promised to come back to cover three loose ends: (1) a pricing of the company to contrast with my intrinsic valuation, (2) a valuation of a Spotify subscriber and, by extension, a subscriber-based valuation of the company, and (3) the value of big data, seen through the prism of what Spotify can learn about its subscribers from their use of its service, and convert to profits.

1. The Pricing of Spotify
I won't bore you by going through the full details of the contrast that I see between pricing an asset and valuing it, since it has been at the heart of so many of my prior posts (like this, this and this). In short, the value of an asset is determined by its expected cash flows and the risk in these cash flows, which you can estimate imprecisely using a discounted cash flow model. The price of an asset is based on what others are paying for similar assets, requiring judgments on what comprises similar.  My last post reflected my attempt to attach an intrinsic value to Spotify, but the pricing questions for Spotify are two fold: the companies that investors in the market will compare it to, to make a pricing judgment, and the metric that they will base the pricing on.

Let's start with the simplest version of pricing, a one-on-one comparison. With Spotify, the two companies that are likeliest to be offered as comparable firms are Pandora, a company that is in the same business (music streaming) as Spotify, deriving its revenues from advertising and subscription, and Netflix, a company that is also subscription-driven, and one that Spotify would like to emulate in terms of market success. Since Spotify and Pandora are reporting operating losses, there are only three metrics that you can scale the pricing of these companies to: the number of subscribers, total revenues and gross profits. I report the numbers for all three companies in the table below, in conjunction with the enterprise values for Pandora and Netflix:
For Pandora and Netflix, the numbers for users and revenues/profits come from their most recent annual reports for the year ending December 31, 2017, and for Spotify, the numbers are from the prospectus covering the same year. To use the numbers to price Spotify, I first estimate pricing multiples for Pandora and Netflix. and then use these multiples on Spotify's metrics:
To illustrate the process, I price Spotify, relative to Pandora and based on subscribers, by first computing the enterprise value/subscriber for Pandora (EV/Subscriber= 1135/74.70 = 15.19). I then multiply this value by Pandora's total subscriber count of 159 million to arrive at a pricing of $2,416 million for Spotify. I repeat this process for Netflix, and then repeat it again with both companies, using revenues and gross profit as my scaling variables. The table of pricing estimates that I get for Spotify explains why those who are bullish on the company will try to avoid comparisons to Pandora and encourage comparisons to Netflix. If, as is rumored, Spotify's equity is priced at between $20 and $25 billion, it will look massively over priced, if compared to Pandora, but be a bargain, relative to Netflix. As you can see, each of these comparisons has problems. Spotify not only has a more subscription-based revenue model than Pandora, yielding higher overall revenues, but its more global presence (than Pandora) has insulated it better from competition from Apple Music. Netflix has an entirely subscription-based model and generates more revenues per subscriber, while facing less intense competition.  The bottom line is that the pricing range for Spotify is wide, because it depends on the company you compare it to, and the metric you base the pricing on. That may come as no surprise for you, but it will explain why there will wide divergences in pricing opinion when the stock first starts to trade, resulting in wild price swings. If you are not adept at the pricing game, and I am not, you should stay with your value judgment, flawed though it might be. I will consequently stick with my intrinsic value estimate for the equity in the company.

2. A Subscriber-Based Valuation of Spotify
Last year, I did a user-based valuation of Uber and used it to understand the dynamics that determine user value and then to value Amazon Prime. That framework can be easily adapted to value Spotify subscribers, both existing and new. To value Spotify's existing subscribers, I started with the base revenue per subscriber and content costs in 2017, made assumptions about growth in each item and used a renewal rate of 94.5%, based again upon 2017 numbers (all in US dollar terms):
Download spreadsheet
Note that revenues/subscriber grow at 3% a year, faster than the growth rate of 1.5%/year in content costs, reducing content costs to 70% of subscriber revenues in year 10, consistent with the assumption I made in the top down valuation in the last post. The value of a premium subscriber, allowing for the churn in subscriptions (only 43% make it through 15 years) and reduced content costs, is $108.65, and the total value of the 71 million premium subscriptions works out to about $7.7 billion.

To estimate the value of new users, I first had to estimate how much Spotify was spending to acquire a new user. To obtain this value, I took the total marketing costs in 2017 (567 million Euros or $700 million) and divided that by the number of new subscribers added in 2017:
Cost of acquiring new user = 700 / (71 - 48*.945) = $27.30
While the number of premium subscribers grew from 48 million to 71 million, I reduced the former value by the churn reported (5.5% of subscribers canceled in 2017). The value of new subscribers then can be computed, assuming that the number of net subscribers grows 25% a year from years 1-5, 10% a year from years 6-10 and 1% a year thereafter (The weakest link in this calculation is the churn rate, which as some of you pointed out is measured in monthly terms. I read this section of the prospectus multiple times to get a better sense of renewal and cancellation rates and here is what I get out of that reading. If the true monthly churn rate is 5.5%, the annual churn rate should more than 50%, meaning that 25 million of the 48 million subscribers that Spotify had at the start of the year left during the year. I don't think that happened, because the total subscribers would not have jumped to 71 million. My guess is that the monthly churn rate reflects how new subscribers become established subscribers, with many trying the service for a month, dropping it, and then coming back again. The annualized churn rate is probably closer to 15%-20% overall and much lower for established Spotify subscribers. I considered using a lower renewal rate in the early years and increasing it in later years, but gave up on it since my information is still hazy. I do believe that will be a key factor in whether Spotify can deliver value, and while the trend lines on the churn rate are good, they need to make their subscribers as sticky as Netflix has made its subscribers.)
Download spreadsheet
In valuing the cash flows from new users, I use a 10% US$ cost of capital, the 75th percentile of global companies, reflecting the higher risk in this component of Spotify's value, and derive a value of about $13.6 billion for new users. (I thank the readers who noticed that I was misestimating my subscriber count, starting in year 2. The numbers should now gel, with the growth rate in net subscribers matching up.)

Spotify does get about 10% of its revenues from advertising, and I will assume that this component of revenue will persist, albeit growing at a lower rate than premium subscription revenues; the revenues will grow 10% a year for the next ten year and content costs attributable to these revenues will also show the same downward trend that they do with premium subscriptions. The value of the advertising revenues is shown to be about $2.9 billion:
Download spreadsheet
The final component of value is mopping up for costs not captured in the pieces above. Specifically, Spotify has R&D and G&A costs that amounted to 660 million Euros in 2017 (about $815 million), which we assume will grow 5% a year for the next 10 years, well below the growth rate of revenues and operating income, reflecting economies of scale. Allowing for the tax savings, and discounting at the median cost of capital (8.5%) for a global company, I derive a value for this cost drag:
Download spreadsheet
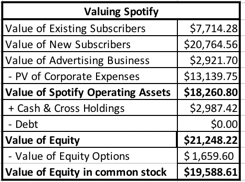
The value for Spotify, on a user-based valuation, can then be calculated, adding in the cash balance (1,5091.81 million Euros or $1,864 million) and a cross holding in Tencent Music that I had overlooked in my DCF (valued at 910 million Euros or $1,123 million), and netting out the equity options outstanding (valued at 1344 million Euros or $1660 million):
Download spreadsheet
The operating asset value is slightly lower than the value that I obtained in my top-down DCF (by about a billion), and there are two reasons for the difference. The first is that I did not incorporate the benefits of the losses that Spotify has to carry forward (approximately $1.7 billion) in my subscriber-based valuation, with the resulting lost tax benefit at a 25% tax rate, of about $300 million. The second reason is that I used a composite cost of capital of 9.24% on all cash flows in top down valuation, whereas I used a lower (8.5%) cost of capital for existing users and a higher (10% cost of capital) for new users; that translates into about $600 million in lower value. The value of equity in common stock, the number that will be most directly comparable to market capitalization on the day of the offering, is $19.6 billion.

3. The Big Data Premium?
There is one final component to Spotify's value that I have drawn on only implicitly in my valuations and that is its access to subscriber data. As Spotify adds to its subscriber lists, it is also collecting information on subscriber tastes in music and perhaps even on other dimensions. In an age where big data is often used as a rationale for adding premiums to values across the board, Spotify meets  the requirements for a big data payoff, listed in this post from a while back. It has exclusivity at least on the information it collects from its subscribers on their musical tastes & preferences and it can adapt its products and services to take advantage of this knowledge, perhaps in helping artists create new content and customizing its offerings. That said, I do no feel the urge to add a premium to my estimated value for three reasons:
  1. It is counted in the valuations already: In both my top down and user-based valuations, I allow Spotify to grow revenues well beyond what the current music market would support and lower content costs as they do so. That combination, I argued, is a direct result of their data advantages, and adding a premium to my estimated valued seems like double counting.
  2. Decreasing Marginal Benefits: The big data argument, even if based on exclusivity and adaptive behavior, starts to lose its power as more and more companies exploit it. As Facebook reviews our social media posts and tailors advertising, Amazon uses Prime to get into our shopping carts and Alexa to track us at home, and uses that data to launch new products and services and Netflix keeps track of the movies/TV that we watch, stop watching and would like to watch, there is not as much of us left to discover and exploit.
  3. Data Backlash: Much as we would like to claim victimhood in this process, we (collectively) have been willing participants in a trade, offering technology companies data about our private lives in return for social networks, free shipping and tailored entertainment. This week, we did see perhaps the beginnings of a reassessment of where this has led us, with the savaging of Facebook in the market. 
The big data debate has just begun, and I am not sure how it will end. I personally believe that we are too far gone down this road to go back, but there may be some buyers' remorse that some of us are feeling about having shared too much. If that translates into much stricter regulations on data gathering and a reluctance on our part to share private data, it would be bad news for Spotify, but it would be worse news for Google, Facebook, Netflix and Amazon. Time will tell!
    YouTube Video


    Data Links
    Share:

    Friday, March 16, 2018

    Stream On: An IPO Valuation of Spotify!

    In the last few weeks, we have seen two high profile unicorns file for initial public offerings. The first out of the gate was Dropbox, a storage solution for a world where gigabyte files are the rule rather than the exception, with a filing on February 23. Following close after, on February 28, Spotify, positioning itself as the music streaming analog to Netflix, filed its prospectus. With it's larger potential market capitalization and unusual IPO structure, Spotify has attracted more attention than Dropbox, and I would like to focus this post on it.

    Spotify: The Back Story
    Spotify was founded in 2008 in Sweden, by Daniel Ek and Martin Lorentzon, as a music streaming service. The timing was opportune, since the company caught and contributed to a shift in the music business, as users have moved away from paying for physical (records, CDs) to digital, as evidenced in the graph below:
    Source: IFPI
    Note that not only has the move towards streaming, in proportional terms, been dramatic, but disruption has come with pain for the music business, with a drop in aggregate revenues from $24 billion in 1999 to about $16 billion in 2016.  In a bright spot, revenues have started rising again in 2016 and 2017, and it is possible that the business will rediscover itself, with a new digital model. Spotify was not the first one in the business, being preceded by both Pandora and Soundcloud, but its success is testimonial to the proposition that the spoils seldom go to the first movers in any business disruption.

    The Spotify business model is a simple one. Listeners can subscribe to a free version, with limited customization features (playlists, stations etc.) and online ads. Alternatively, they can subscribe to a premium version of the service, paying a monthly fee, in return for a plethora of customization options, and no ads. The company's standard service cost $9.99/month in the United States in 2018, with a family membership, where up to six family members living at the same address, can share a family service for $14.99/month, while preserving individualized playlists and stations. Prices vary globally, ranging from a high of $16.94 in the UK (for standard service) to much lower prices in Eastern Europe and Latin America. (You can check out the variations in this fascinating link that reports the prices across the world for Spotify, in dollar terms.) Spotify pays for its music content, based upon how often a song is streamed, but the rates vary depending on whether it is on the free or premium service and where in the world, creating some complexity in how it is computed.  To get a sense of where Spotify stands right now and how it got there, I looked the prospectus, with the intent of catching broad trend lines. I came up with the following:

    1. Explosive Growth: Spotify is coming off a growth burst, especially since 2015, in both number of users and revenues, as can be seen in the graph below. Revenues have increased from 1.94 billion Euros to 4.09 billion Euros, reflecting both a growth in subscribers from 91 million to 159 million, and a change in the composition, with premium members climbing from about 31% of total subscribers in 2015 to 45% of subscribers in 2017.
      Source: Spotify Prospectus
    2. Subscription Revenue dominates Ad Revenue: Spotify's focus on improving its premium subscriptions is explained easiest by looking at the breakdown of revenues each year, where subscription revenues have accounted for 90% of revenues each year from 2015 to 2017. The one discordant note is that average revenue per premium subscriber has dropped over the same period 7.06 Euros/month to 5.24 Euros/month, a change that the company ascribes to family memberships, but a problematic trend nevertheless:
      Source: Spotify Prospectus
    3. Content Costs are coming down: While Spotify insists that it is not scaling back payouts to music labels and artists, the company has been able to lower its content costs as a percent of revenues each year from 88.7% of revenues in 2015 to 79.2% of revenues in 2017. In fact, Spotify has conveyed to investors that its intent is to earn gross margins of 30%-35%, implying that it sees content costs dropping to 65%-70% of revenues. There is an inherent tension here between what Spotify has to convince its investors it can do and what it tells the music industry  it is doing and the tension will only intensify, after the company goes public.
      Source: Spotify Prospectus
    4. Other costs are trending up: There are three other buckets of cost at Spotify -R&D, Selling & Marketing and G&A- and these costs are not only growing but eating up larger proportion of revenues. If there are economies of scale, as you would expect in most businesses,  they are not manifesting themselves in the numbers yet. The collective load of these expenses are creating operating losses, and while margins have become less negative, it is primarily through the content cost controls.

      Source: Spotify Prospectus

    At this stage of its story, Spotify is a growth company with lots of potential (no irony intended) but lots of rough spots to work out.

    The Spotify IPO
    I have posted ahead of IPOs for many companies in the last decade, ranging from Facebook to Twitter to Alibaba to Snap, but Spotify's IPO is different for two reasons:
    1. No Banks: In a typical IPO, the issuing company seeks out an investment bank, which not only sets an offering price (backed up by a guarantee) but also creates a syndicate with other banks  to market the IPO, in roadshows and private client pitches. The Spotify IPO will dispense with the bankers and go directly to the market, letting demand and supply set the price on the opening day.
    2. Cashing Out: In most IPOs, the cash that comes in on the offering, from the shares that are bought by the public, is kept in the company, either to retire existing financing that is not advantageous to the firm, or to cover future investment needs. Spotify is aiming to raise about $1 billion from its offering, but none of it will go to company. Instead, existing equity investors in the company will be receiving the cash in return for their holdings.
    As a potential investor, I am less concerned about the "no banker" part of the IPO than I am by the "cash out:" part of the transaction: 


    • No bankers, no problem: I think that the banking role in IPOs is overstated, especially for a company as high profile as Spotify. Bankers don't value IPOs; they price them, usually with fairly crude pricing metrics, though they often reverse engineer DCFs to back up their pricing. Their guarantee on the offering price is significantly diluted in value by the fact that they set offering prices 10% to 15% below what they think the market will bear, and their marketing efforts are more useful in gauging demand than in selling the securities. From an investor perspective, there is little that I learn from road shows that I could not have learned from reading the prospectus, and there is almost as much disinformation as information meted out as part of the marketing.
    • Control or Growth: I find it odd that a company like Spotify, growing at high rates and losing money while doing so, would turn away a billion in cash that could be used to cover its growth needs for the near future. The cashing out of existing owners sends two negative signals.  The first is that they (equity investors who cash out) do not feel that staying on as investors in the company, as a publicly traded entity, is worth it. Since they have access to data that I don't, I would like to know what they see in the company's future. The second is that the structure of the share offering, with voting and non-voting shares, indicates a consolidation of control with the founders, and the offering may provide an opportunity to get rid of dissenting voices.

    My Spotify Valuation
    In keeping with my view that you need a story to provide a framework for you valuation inputs, and especially so for young companies, I constructed a story for Spotify with the following elements:
    1. Continued (but Slower) Revenue Growth: Spotify's success in scaling up over the last three years also sets the stage for a slowing down of growth in the future, with competition for Apple Music (backed by Apple's deep pockets) contributing to the trend. A combination of increases in subscriber numbers and a leveling off and even a mild increase in subscription per member will translate into a revenue growth of 25% a year for the next five years, scaling down to much lower growth in the years after. Since I am projecting revenues for Spotify in 10 years that are larger than the reported global music business revenues today, implicit in this story is the assumption that the music business overall has turned the corner and that aggregate revenues will not only continue to post increases like they did in 2016 and 2017, but that streaming will be the savior of the music business, allowing it expand its reach into emerging markets and pick up more paying customers. 
    2. With Reduced Content Costs: Spotify's entire value proposition rests on improved operating margins and a large portion of the improvement has to come from continuing to reduce content costs as a percent of revenues. Since Spotify pays for its content based upon song streams, those savings have to come from either paying less per stream (which is going to and should create push back from labels and artists) or finding ways to create economies of scale on this cost component. In it's defense, Spotify can point to its track record from 2015 to 2017 in reducing content costs. I assume that they can reduce content costs to 70% of revenues, while finding a way to keep artists and labels happy. That is not going to be an easy balance to maintain, especially with the top artists, as evidenced by Taylor Swift's and Jay-Z's decisions to pull their music from Spotify. (I have been told that they have reversed their decisions, but this fight is ongoing.)
    3. And Economies of Scale on Other Costs: Of the three other costs, the marketing expenses are the ones most likely to scale down as growth declines, but for Spotify to deliver solid operating margins, it also has to bring R&D costs and G&A costs under control. I may be over optimistic on this front, but here is what my projected values yield for my target operating margin (ten years from now):
    4. With Limited Capital Investments: Spotify's business model is built for scaling, with little need for capital reinvestment, except for R&D. Consequently, I assume that small capital investments can generate large revenues, using a sales to capital ratio of 4.00 (putting it at the 90th percentile of global companies) to estimate reinvestment.
    5. Manageable Operating Risk but Significant Failure Risk: Spotify's subscription based model and low turnover rate among subscribers does lend some stability to revenues, though adding more subscribers and going for growth is a riskier proposition. Overall, allowing for their business mix (90% entertainment, 10% advertising) and their global mix of revenues yields a  cost of capital of 9.24%, at the 80th percentile of global companies; the firm is planning to convert much of its debt into equity at the time of the IPO, giving it a equity dominated capital structure. However, the company is still young, losing money and faces deep pocketed competition, suggesting that failure is a very real possibility. I assume a 20% chance of failure, with failure translating into selling the company to the highest bidder at half of its going concern value.
    6. Loose Ends: To estimate equity value in common shares, I add the cash balance of the company of 1.5 billion Euros and a cross holding in Tencent Music (valued at 910 million Euros), ignore the proceeds from the IPO because of the cash-out structure and net out the value of 20.82 million options/warrants outstanding, with an average strike price of 42.56 Euros per share. Dividing the equity value of 16.5 billion Euros by 177.17 million shares (including restricted shares) yields a value per share of 93.40 Euros per share or $115.31. The shares that you will be buying will be non-voting, implying a discount on this number, though how much you discount it will depend on how much you like and trust the company's founders.
    The entire picture, with the story embedded in it, is shown below. You can also download the spreadsheet here. (The base year numbers in the prospectus were all in Euros, but all of the valuation inputs (growth, cost of capital) are in US dollars, making it a US dollar valuation. In hindsight, I should have restated the base year numbers in US dollars. While it would not have changed the valuation, it would have reduced currency confusion. Alternatively, I could have valued the company entirely in Euros, with lower growth rates and costs of capital, and arrived at Euro valuation that yield roughly similar results):
    Download spreadsheet
    It goes without saying, but I will say it anyway, that I made lots of assumptions to get to my value and that you may (and should) disagree with me or some or even all of these assumptions. You are welcome to download the spreadsheet that contains my valuation of Spotify and make it your own.

    Bottom Line
    There are three elements missing in this post. First, I have argued in my prior IPO posts that what happens after initial public offerings is more of a pricing game than a value game. To those of you who want to play that game, I don't think that this post is going to be very helpful. In my next post, I will look at how best to price Spotify, why you will hear pessimists about the company talk a lot about Pandora and optimists about Netflix. Second, there is the argument that top down valuations, like the one in this post, are ill equipped to value user or subscriber based companies. I will also use the user-based model that I introduced last year to value an Uber rider and an Amazon Prime member to value a Spotify subscriber. Finally, there is the lurking question of what Spotify is learning about its subscriber music tastes and how that data can be used to not only modify its offerings but perhaps create content that is more closely tailored to these tastes. That too has to wait for the next post.

    YouTube

    Data Links
    Share:

    Labels

    Blog Archive

    Recent Posts

    Unordered List

    Theme Support